. 2023 Oct 30;23(23):4967–4985. doi: 10.1039/d3lc00492a

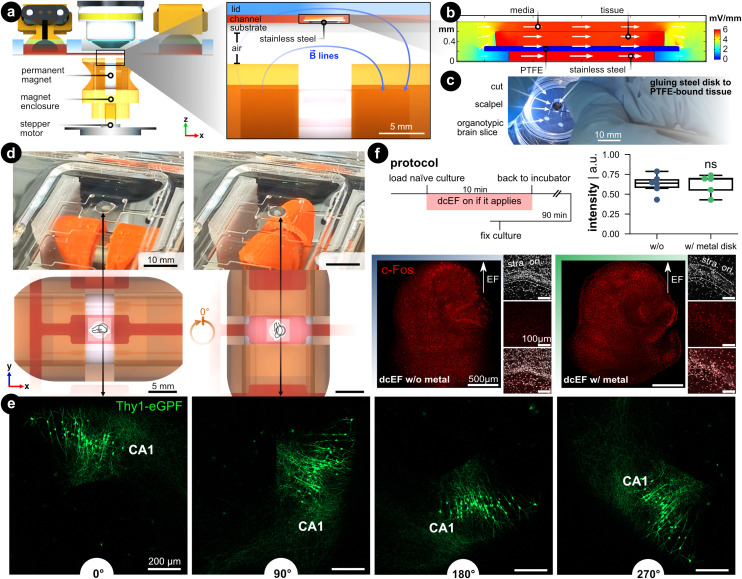
Fig. 7. Controlling the brain slice orientation within the microchannel. (a) Side view of the microfluidic stimulation platform with the rotational add-on. The expanded view shows a cross-sectional view of the s1 microchannel and illustrates the added features that enable rotational control: (1) a ferromagnetic stainless steel disk under the brain slice and culturing membrane, and (2) a programmable rotating permanent magnet. The metal disk is resting on the silicone-coated substrate and is not physically attached. The permanent magnet is housed in a 3D-printed enclosure that fits onto a stepper motor shaft whose rotation is controlled with a microcontroller. The magnet's north–south axis is aligned parallel to the microfluidic chamber, which can be seen with the blue magnetic field lines. (b) FEA simulation of the EF distribution within the s1 microchannel using the same input current used in Fig. 2. Fig. S9 expands on this simulation. (c) Image of cutting the tissue/PTFE/disk stack. Note the disk was glued to the underside of the membrane. (d) Demonstration of the in situ brain slice rotation within the microchannel. The rendering shows a top view of the rotating brain tissue within the s1 microchannel. (e) Rotation of Thy1-eGFP tissue cultures to further visualize the in situ rotation in 90° steps. Note the CA1 region as a datum reference in all rotation images. (f) c-Fos expression after dcEF with and without the metal disk. The insets display the DAPI and c-Fos signal in the CA1 region of the corresponding culture. The box plot shows the c-Fos intensity post-dcEF (4.7 mV mm−1). Mean and quartiles of the whole culture c-Fos signal intensity in two groups (N = 6 and N = 5 for the dcEF-treated cultures without and with the metal disk respectively). Mann–Whitney U test was applied for statistical analysis.

Fig. 7