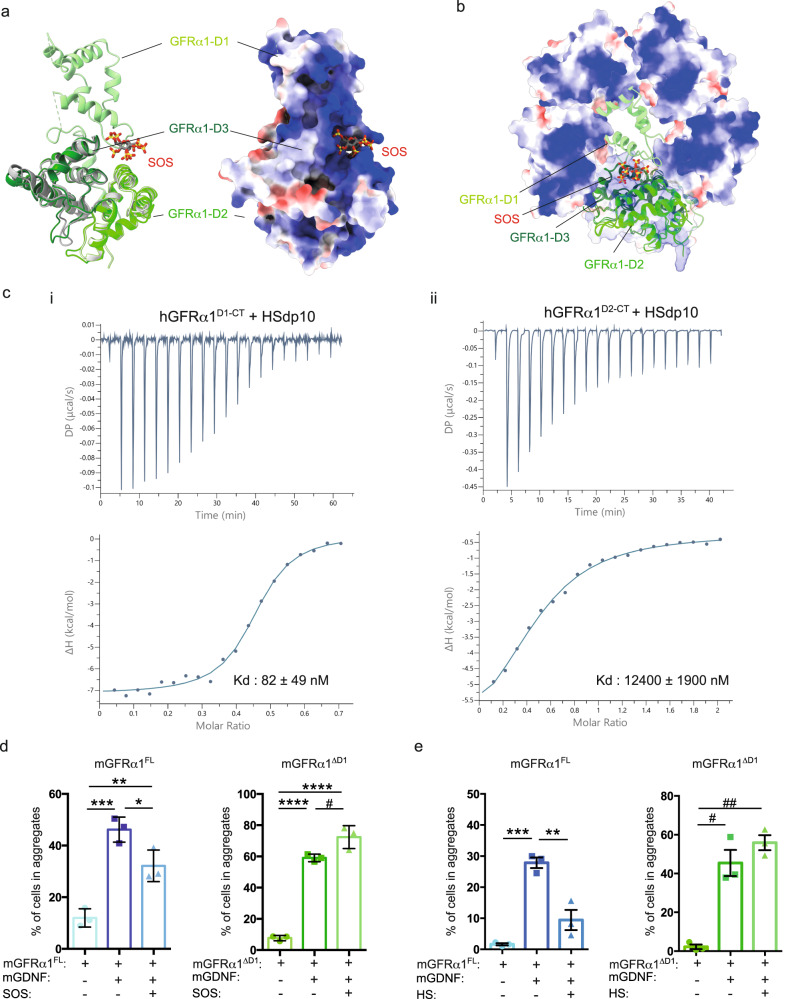
Fig. 5. D1 domain-dependent binding of sulfated glycosaminoglycans (GAGs) disrupts trans-synaptic GDNF-GFRα1 complexes.
a Structural superimposition of the mGFRα1D2-D3-SOS complex (PDB: 2V5E) with an intact zGFRα1D1-D3 (PDB: 7AML) shown as a ribbon representation (left) and a surface rendering coloured according to Columbic electrostatic potential (right). mGFRα1D2-D3 cartoon coloured grey with D2 light grey and D3 in dark grey. zGFRα1D1-D3 cartoon coloured in green with D1 light green, D2 green and D3 dark green. SOS ligand, shown as sticks, binds to a positively charged cleft formed between all three domains. b Steric clash between D1 domain of zGFRα1D1-D3 (PDB: 7AML) and zGFRα1D2-D3 pentamers within the decameric complex. zGFRα1D2-D3 pentamer shown as a surface representation coloured according to electrostatic surface potential. mGFRα1D2-D3-SOS complex (PDB: 2V5E) is superposed onto zGFRα1D1-D3 shown as cartoon coloured in green with D1 light green, D2 green and D3 dark green. Superimpositions were done in UCSF ChimeraX using the MatchMaker tool85. c ITC analysis of hGFRα1 interactions with HS. (i) hGFRα1D1-CT binding to HS dp10 and (ii) hGFRα1D2-CT binding to HS dp10. Raw ITC titration data plotted against time (top) and integrated heat signals plotted as a function of molar ratio (bottom). Circles represent the integrated heat of interaction, while blue curves represent the best fit obtained by non-linear least-squares procedures using the “One set of sites” model. Representative titrations and binding curves are shown. Derived binding constants (Kds) are reported on each plot, as mean values of ≥3 independent experiments ± standard deviation. d, e D1 domain impact of GAGs binding to mGFRα1 in the HEK293 adhesion assay. HEK293T cells were transfected with vector alone, mGFRα1FL or mGFRα1ΔD1 with GFP. GFP-expressing cells were preincubated with SOS (d) or HS (e) for 2 h in the absence of GDNF. GDNF was then added for an additional 2 h at room temperature. The percentage of cells in aggregates greater than 5 cells under the indicated conditions is shown. Mean values of triplicate experiments ± s.e.m. (d) *p = 0.0306, **p = 0.0059, ***p = 0.0004, ****p < 0.0001, #p = 0.0268, (e) **p = 0.021, ***p = 0.0003, #p = 0.0013, ##p = 0.004. One-way ANOVA, followed by Tukey´s multiple comparison test.

