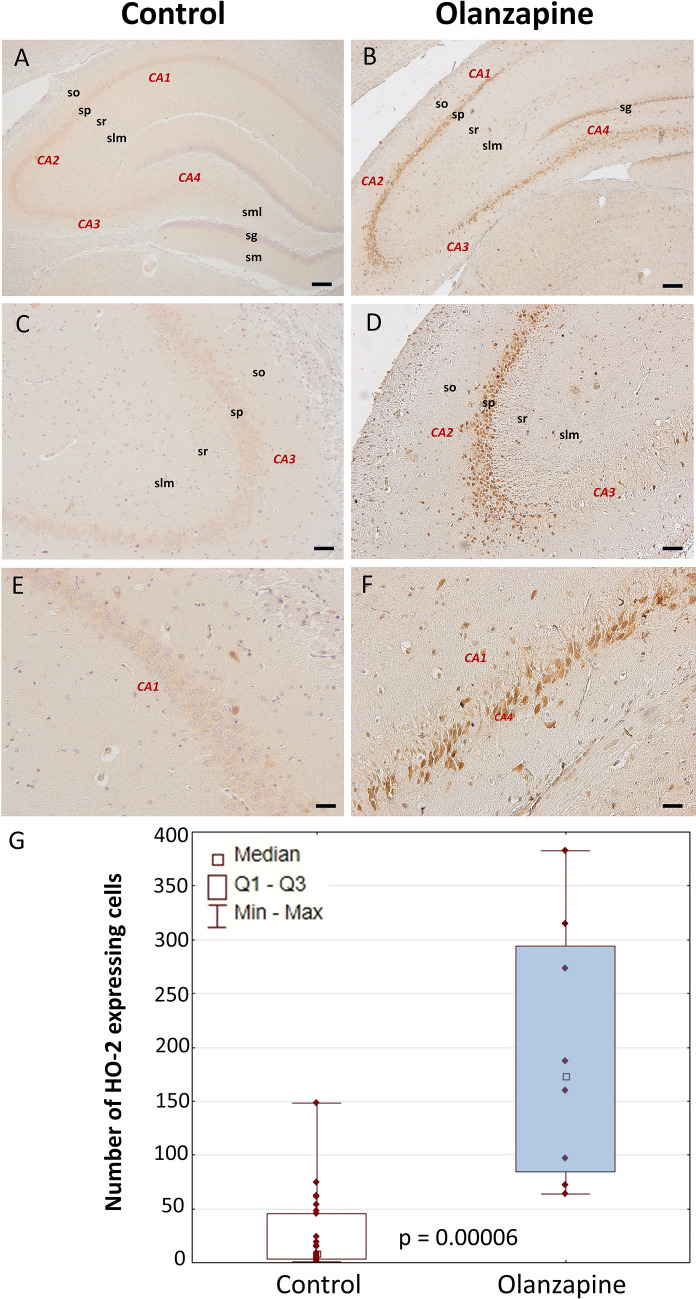
Fig. 3.
Cellular expression of HO-2 in the hippocampus. An overview (A, B). Area CA1 (C–F). DG, dentate gyrus; sg, granular layer of dentate gyrus; slm, stratum lacunosum–moleculare; sm, stratum moleculare of dentate gyrus; sml, multiform layer of the dentate gyrus; so, stratum oriens; sp, stratum piramidale; sr, stratum radiatum. The number of HO-2-expressing cells in the hippocampus of control rats and animals chronically treated with olanzapine (G). Data are presented as median with interquartile ranges. Differences between groups (n = 5) were statistically analyzed using the Mann–Whitney U test and were considered significant at p <0.05. Scale bars: 200 μm (A, B), 100 μm (C, D), 50 μm (E, F)

