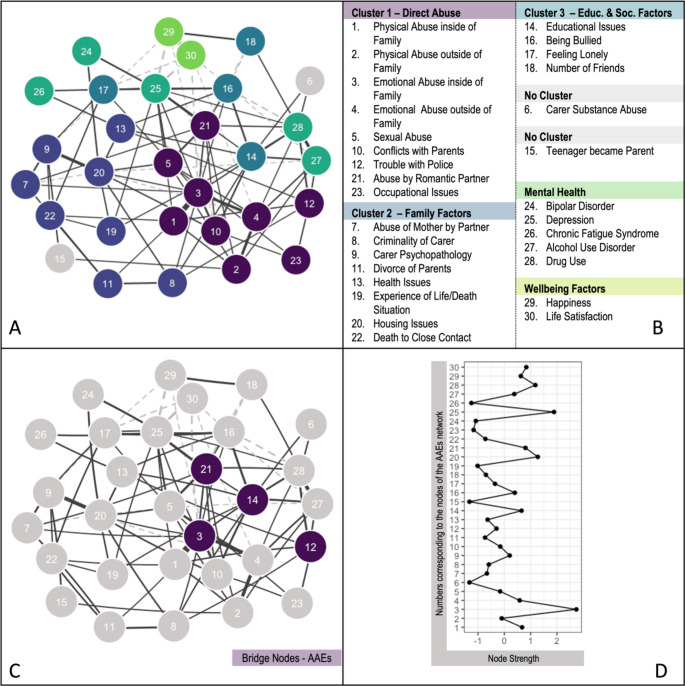
Fig. 2.
A: The AAEs network including the clusters of adversities. Dashed lines represent negative partial correlations, while dark grey lines indicate positive partial correlations. The more saturated the edge, the higher the correlation. B: Network Node Labels. C: Bridge nodes of the adversity cluster (dark lilac). D: Strength scores of the AAEs nodes. Strength refers to the node strength of the AAEs network. Standardised Z-scores are shown for node strength (see B). For interpretation of the references to colour in this figure legend, please refer to the web version of this article.

