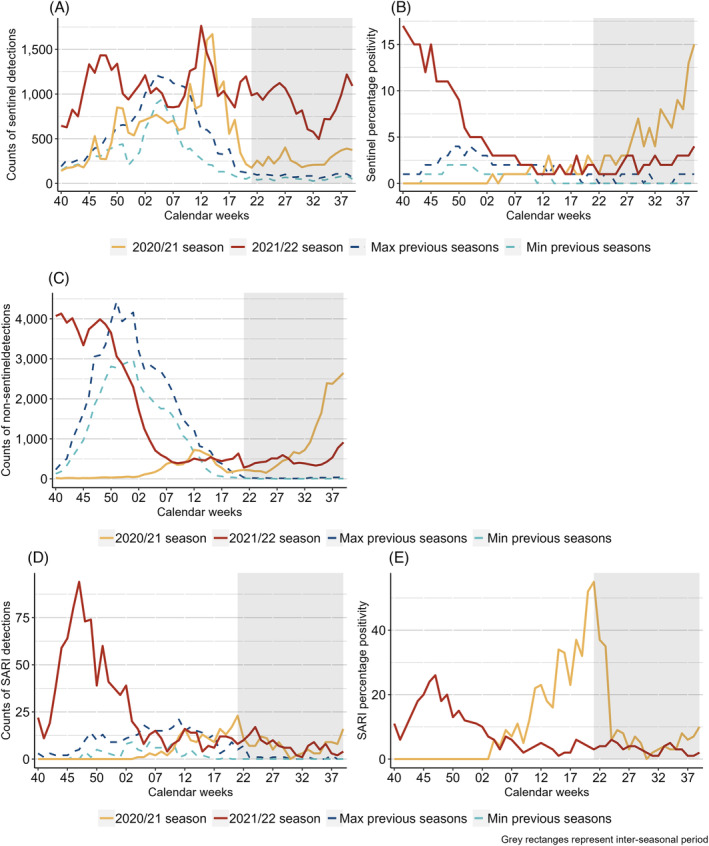
FIGURE 1.

Top row: Count of specimens tested (A) and percentage positivity (B) of RSV specimens per week from sentinel sources compared with the minimum (Min) and maximum (Max) from pre‐COVID‐19 pandemic seasons; middle row: count of non‐sentinel RSV detections compared to the minimum (Min) and maximum (Max) from pre‐COVID‐19 pandemic seasons (C); bottom row: count of specimens tested for RSV (D) and percentage positivity (E) from SARI sites across the selection of countries included, over several seasons. Note: percentage positivity was calculated when at least 10 specimens were tested; grey rectangles represent inter‐seasonal periods; seasons represent the time period ranging from week 40 to 39.
