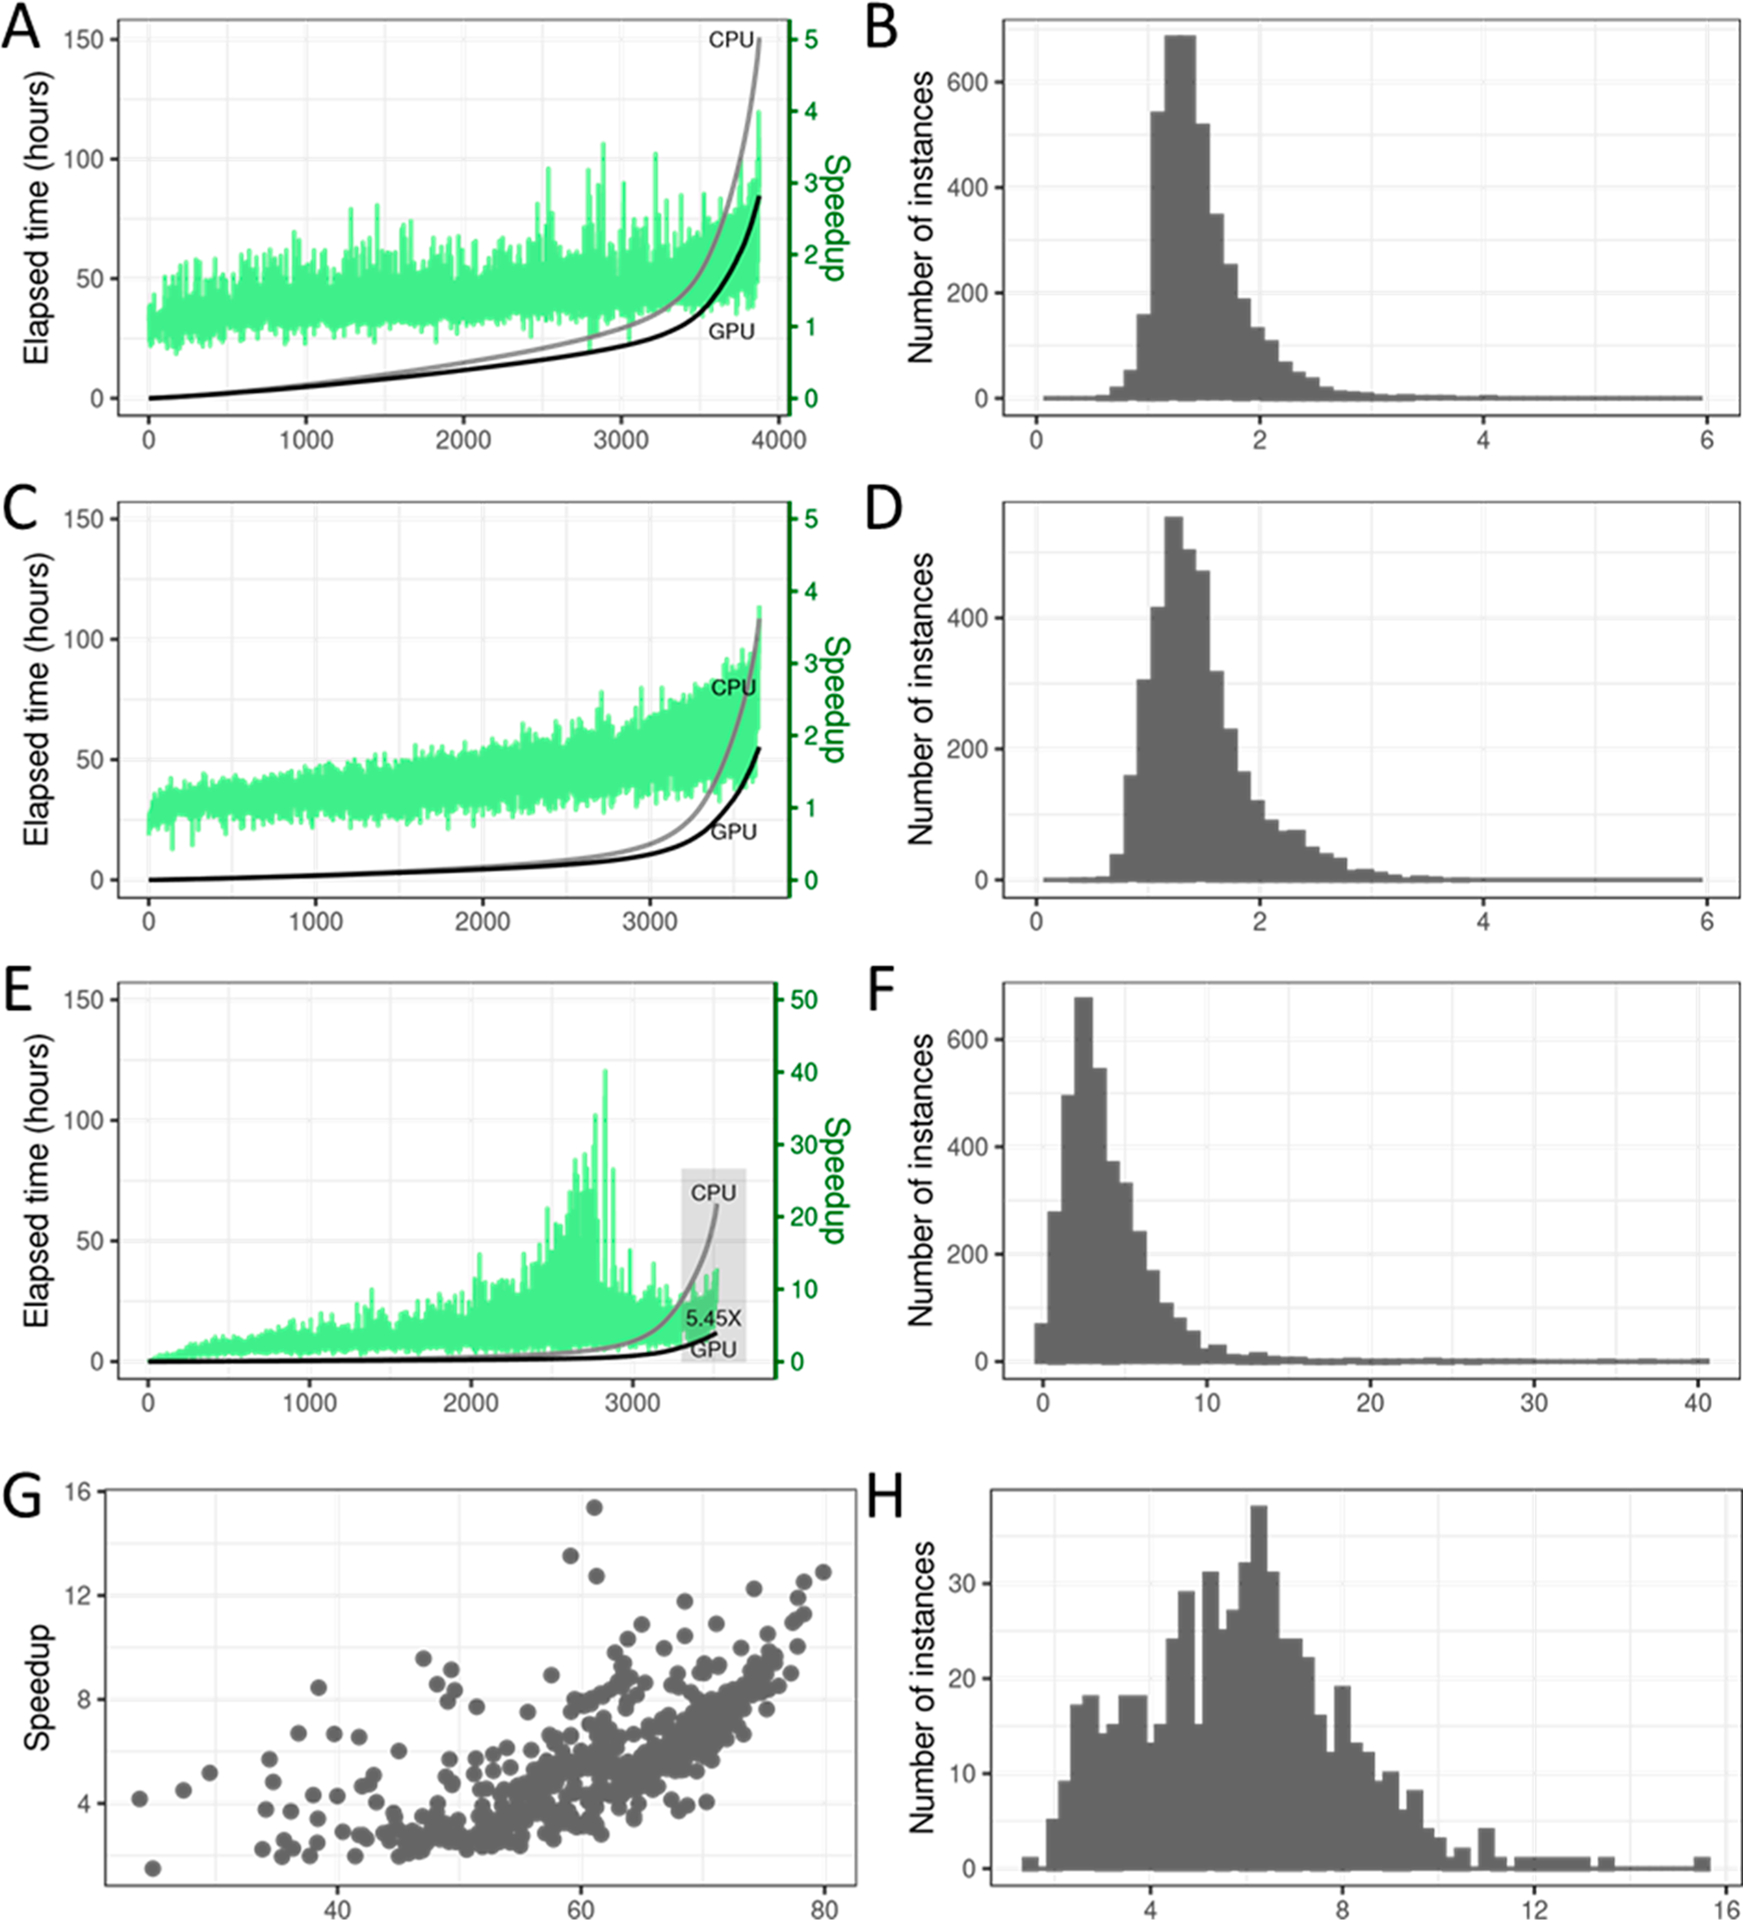
Figure 3.

Overall performance on entire collection of 3875 complexes. (A) Elapsed time in hours for CPU-only and the CPU+GPU codes, with per-instance speedups indicated as green bars on secondary axis. (B) Histogram of per-instance speedup (i.e., ratio of CPU-only time and CPU +GPU execution time). (C) Elapsed time in hours for CPU only and the CPU+GPU codes, with per-instance speedups indicated as green bars on the secondary axis. (D) Histogram of per-instance speedup (i.e., the ratio of CPU-only time and CPU+GPU execution time). (E and F) Performance of the pose search step in coarse docking phase: (E) Elapsed time in hours for CPU-only and the CPU+GPU codes, with per-instance speedups indicated as green bars on the secondary axis. (F) Histogram of per-instance speedup (i.e., the ratio of CPU-only time and CPU+GPU execution time). (G and H) Performance of the pose search step in coarse docking phase on instances where the CPU-only search time is greater than 1 min: (G) Possible correlation between parallelized work and GPU speedup achieved. (H) Histogram of per-instance speedup (i.e., the ratio of CPU-only time and CPU+GPU execution time).
