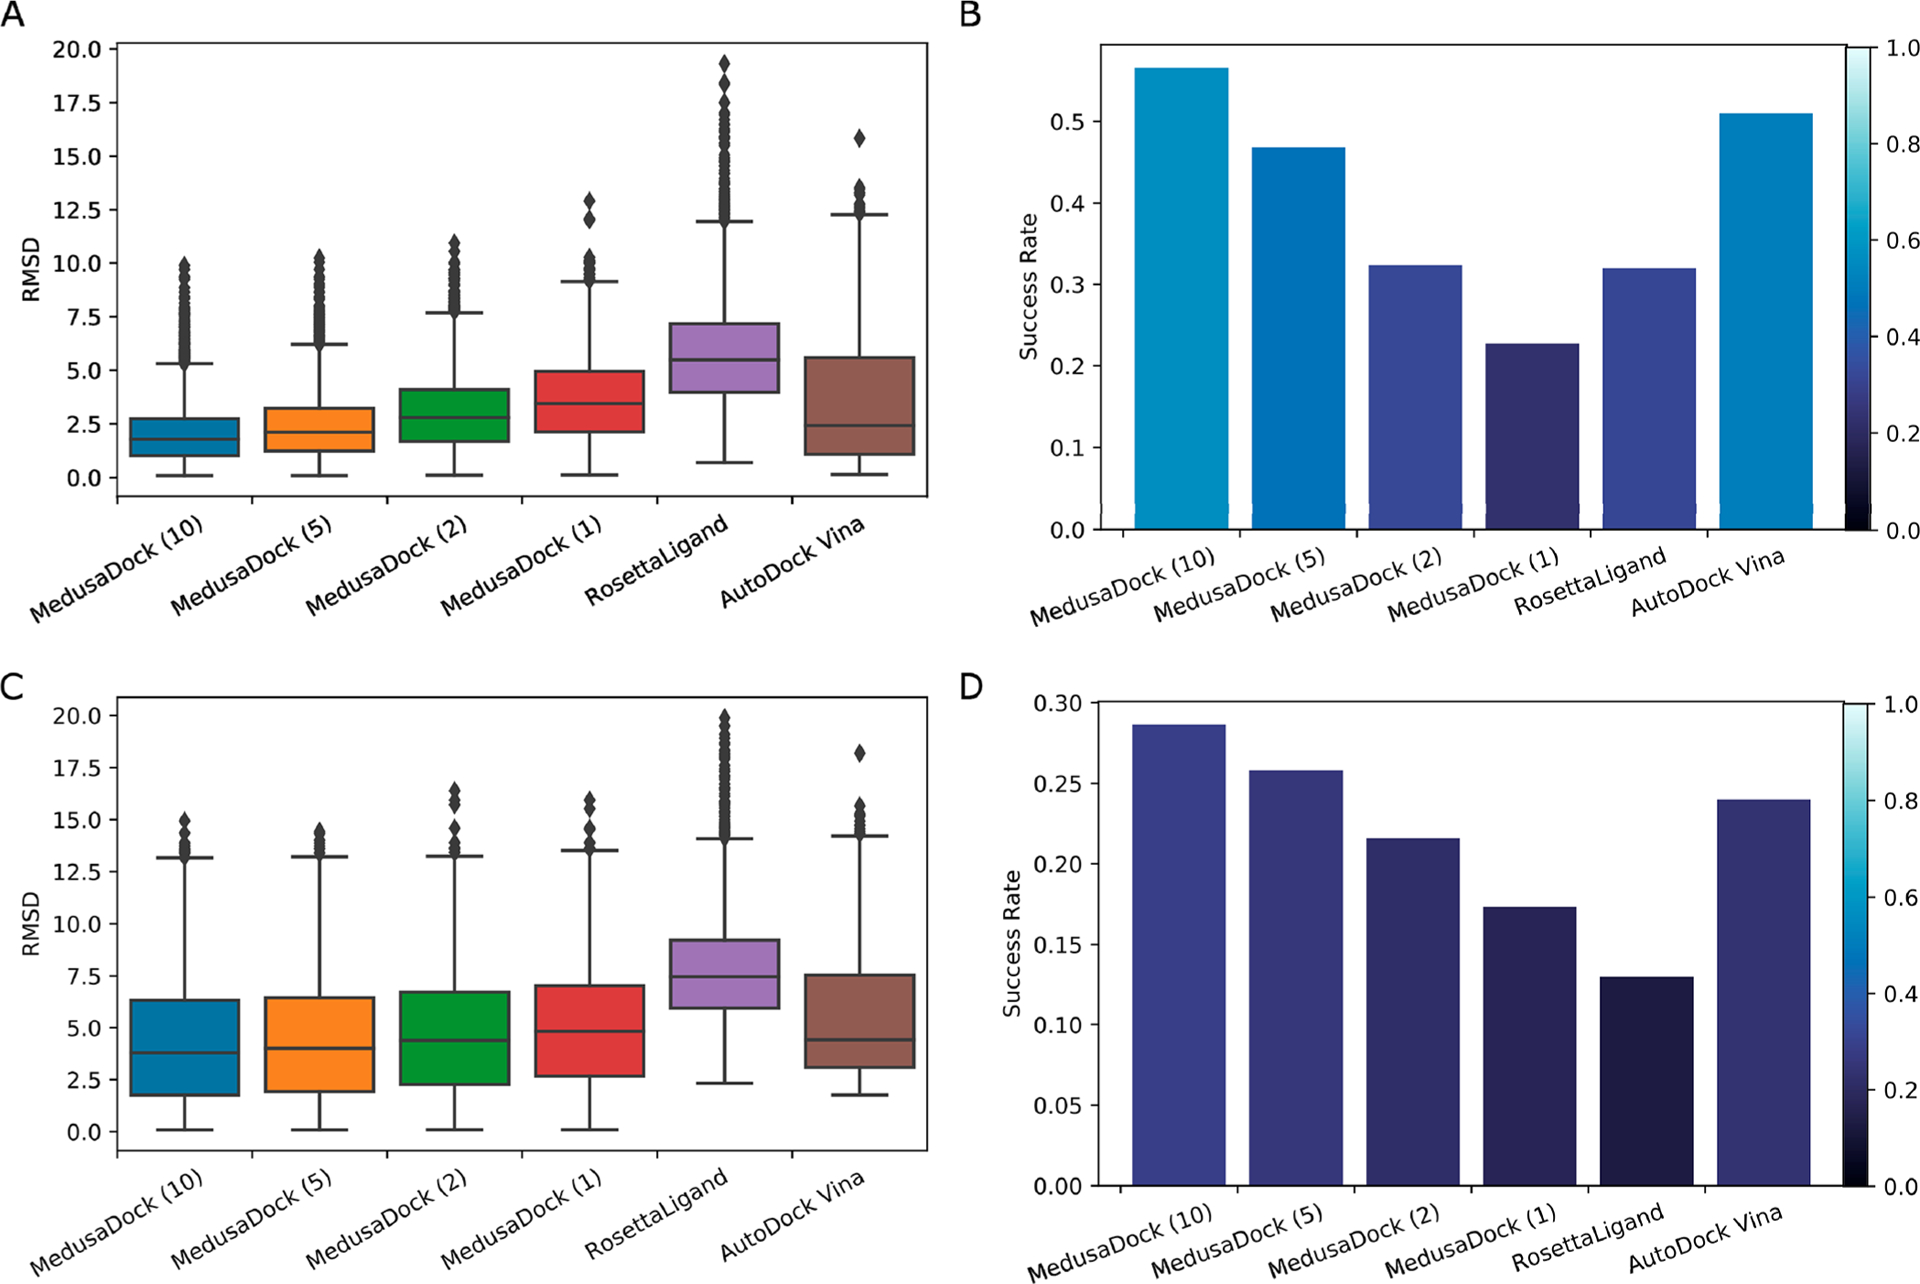
Figure 5.

(A) Distribution of the minimum RMSD of MedusaDock GPU version, RosettaLigand, and AutoDock Vina on the PDBBind data set. The number inside the parentheses stands for the number of iterations of the MedusaDock GPU version. (B) Success rate (minimum RMSD < 2 Å relative to experimental data) of different docking software and different running iterations of MedusaDock GPU version on the PDBBIND data set. (C) Distribution of the RMSD with minimum docking energy of MedusaDock GPU version, RosettaLigand, and AutoDock Vina on the PDBBind data set. (D) Success rate calculated by the RMSD with minimum docking energy of different docking software and different running iterations of MedusaDock GPU version on the PDBBIND data set.
