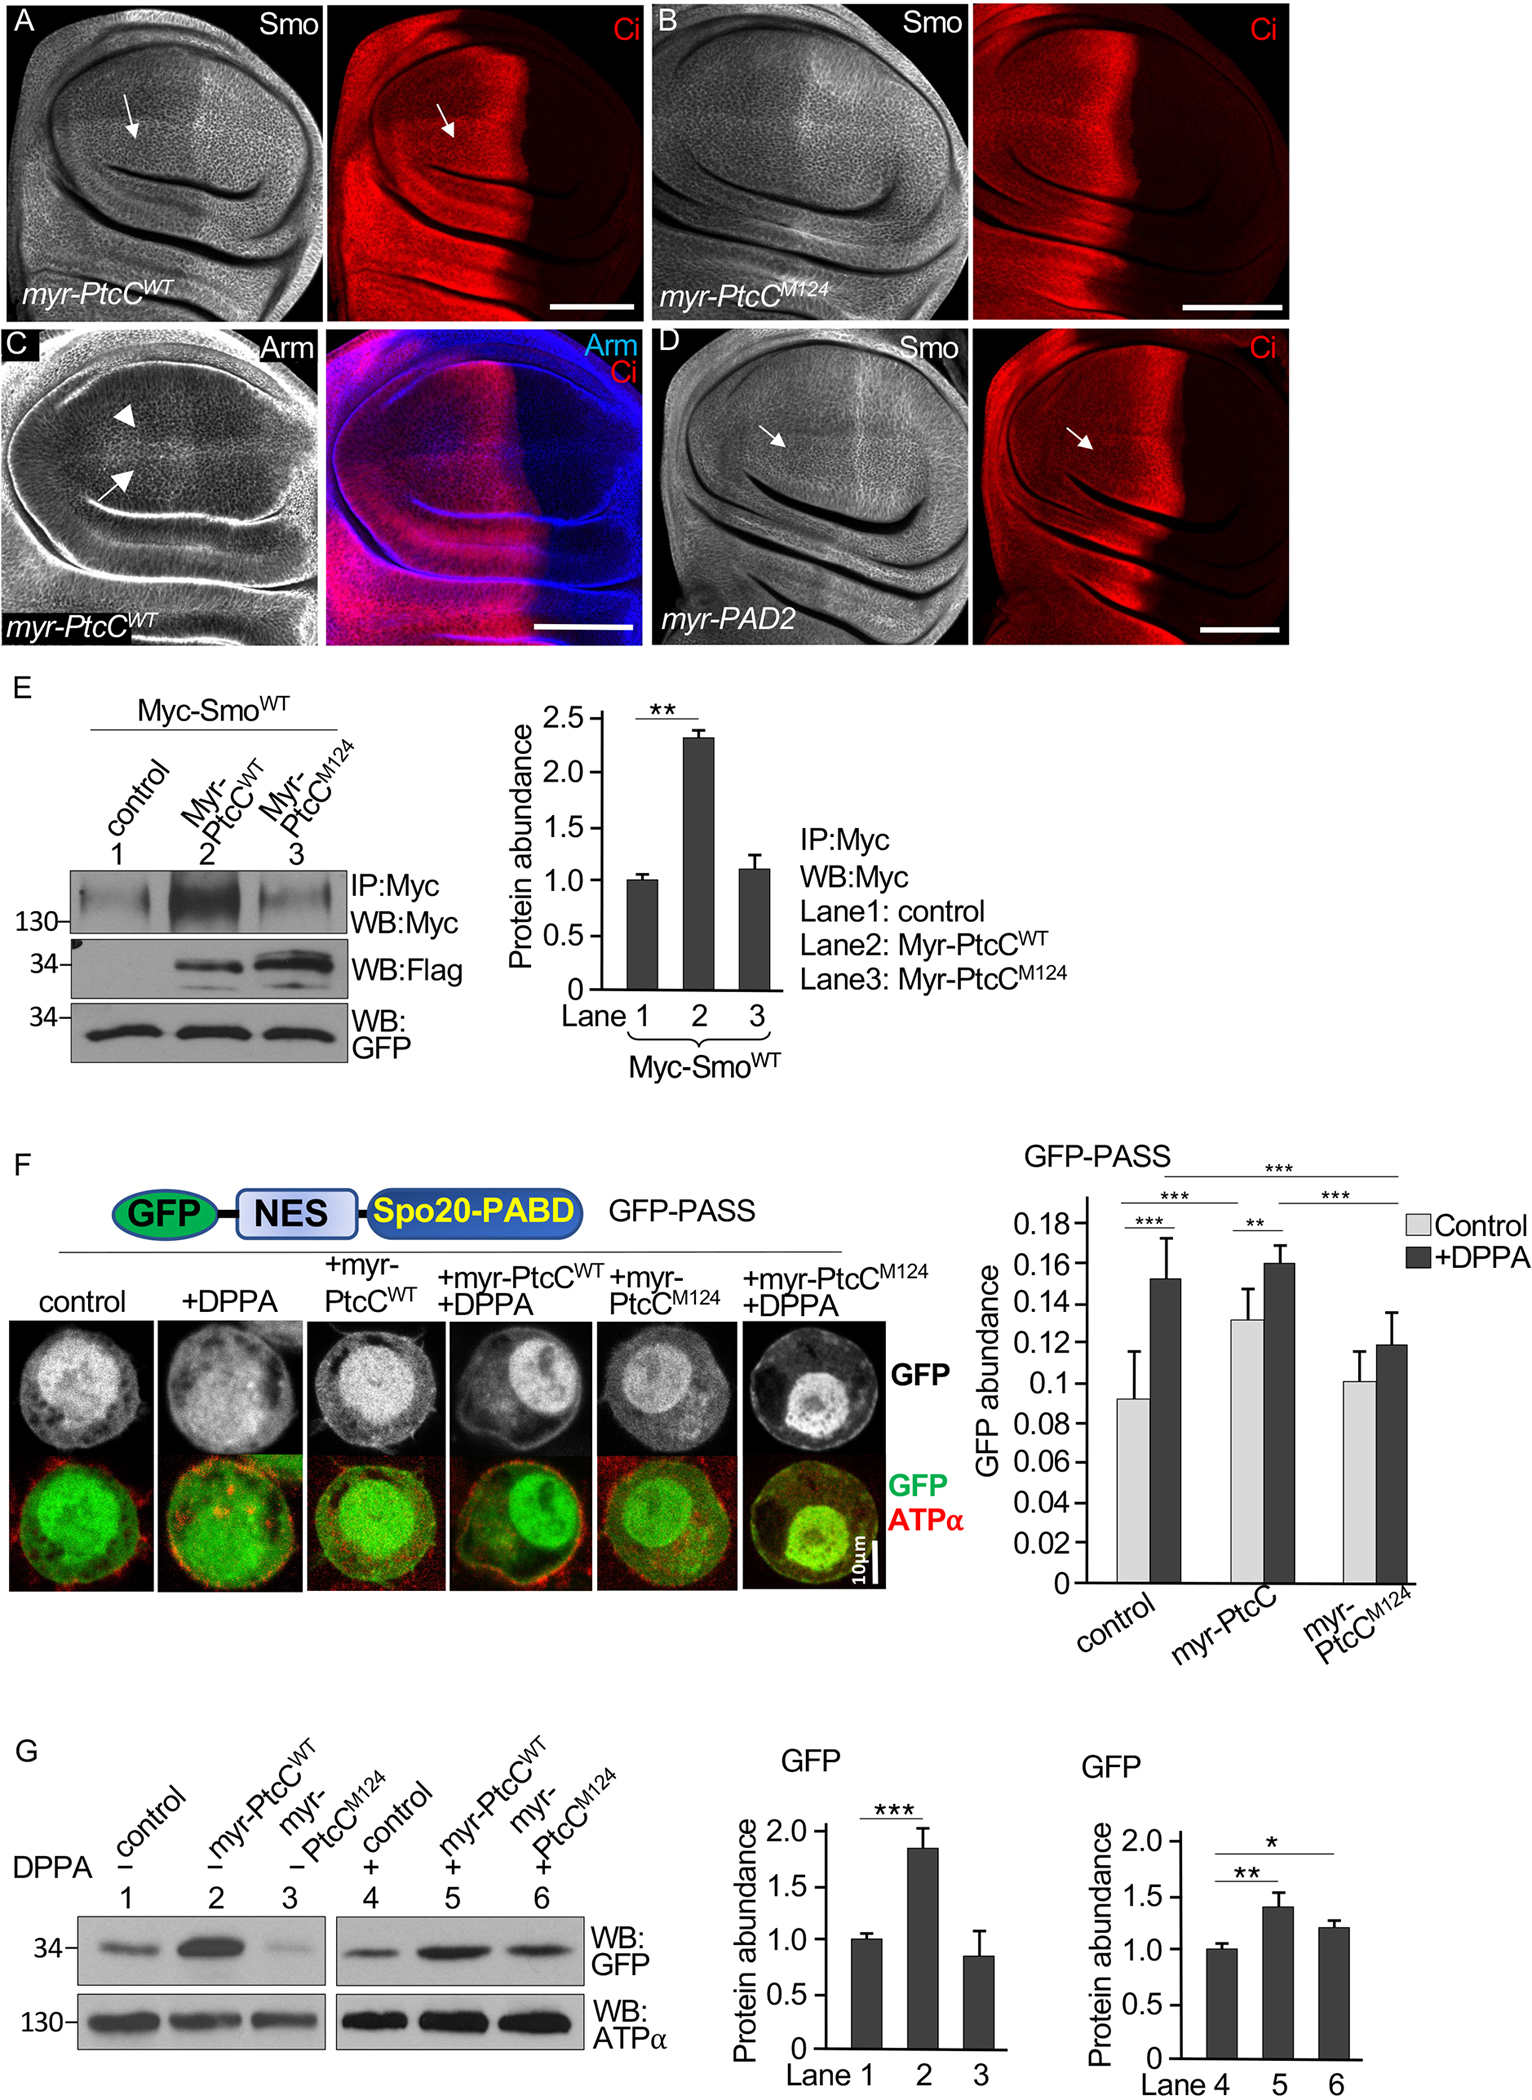
Fig. 4. Membrane-tethered PA binding domains of Ptc enrich PA at the cell surface.

(A and B) Wing discs expressing a membrane-tethered form of the WT Ptc C-tail (myr-PtcCWT, A) or the M124 mutant form (myr-PtcCM124, B) in the dorsal compartment using the ap-Gal4 driver were stained for Smo and Ci. Arrows indicate increased Smo accumulation in the domain of myr-PtcCWT expression in the anterior portion of the dorsal compartment. The flag tag in myr-PtcC was not detectable by immunostaining. N=5 wing discs per genotype. (C) A wing disc expressing myr-PtcCWT under control of the ap-Gal4 driver stained for Arm and Ci. Arrow and arrowhead indicate Arm expression in the dorsal and ventral compartment, respectively. N=3 wing discs. (D) A wing disc expressing myr-PAD2 under control of the ap-Gal4 driver stained for Smo and Ci. Arrows indicate the accumulation of Smo and Ci in the myr-PAD2 expression domain. N=5 wing discs. (E) S2 cells were transfected with Myc-SmoWT, either myr-PtcCWT or myr-PtcCM124, and a control plasmid, UAST-GFP. Lysates were immunoprecipitated (IP) and blotted (WB) with an antibody specific for Myc. Identical volumes of lysates were evaluated on separate blots with an antibody specific for Flag to detect myr-PtcCWT or with an antibody specific for GFP. N=3 independent experiments. The amounts of Myc-SmoWT were quantified. ** indicates a p < 0.01 (Student’s t test). (F) S2 cells were transfected with the GFP-PASS construct (schematic drawing) in combination with myr-PtcCWT or myr-PtcCM124 and treated with DPPA or not. Cells were fixed and stained for the plasma membrane marker ATP⍺. Representative images in individual S2 cells are shown. N=23–25 cells per group from 4 independent experiments. The ratio of cell surface GFP to total GFP (membrane GFP/total GFP) was calculated using the ImageJ software. ** indicates an adjusted p < 0.01, *** indicates an adjusted p < 0.001 (Student’s t test with Bonferroni correction for multiple comparisons adjustment). (G) Membrane fractions from lysates of the cells in (F) were immunoblotted (WB) for GFP and GFP abundance was quantified. ATP⍺ is a loading control. N=3 independent experiments. *** indicates an adjusted p < 0.001; ** indicates a p < 0.01; * indicates a p < 0.05 (Student’s t test with Bonferroni correction). Scale bars, 50 μm (A to D) and 10 μm (F).
