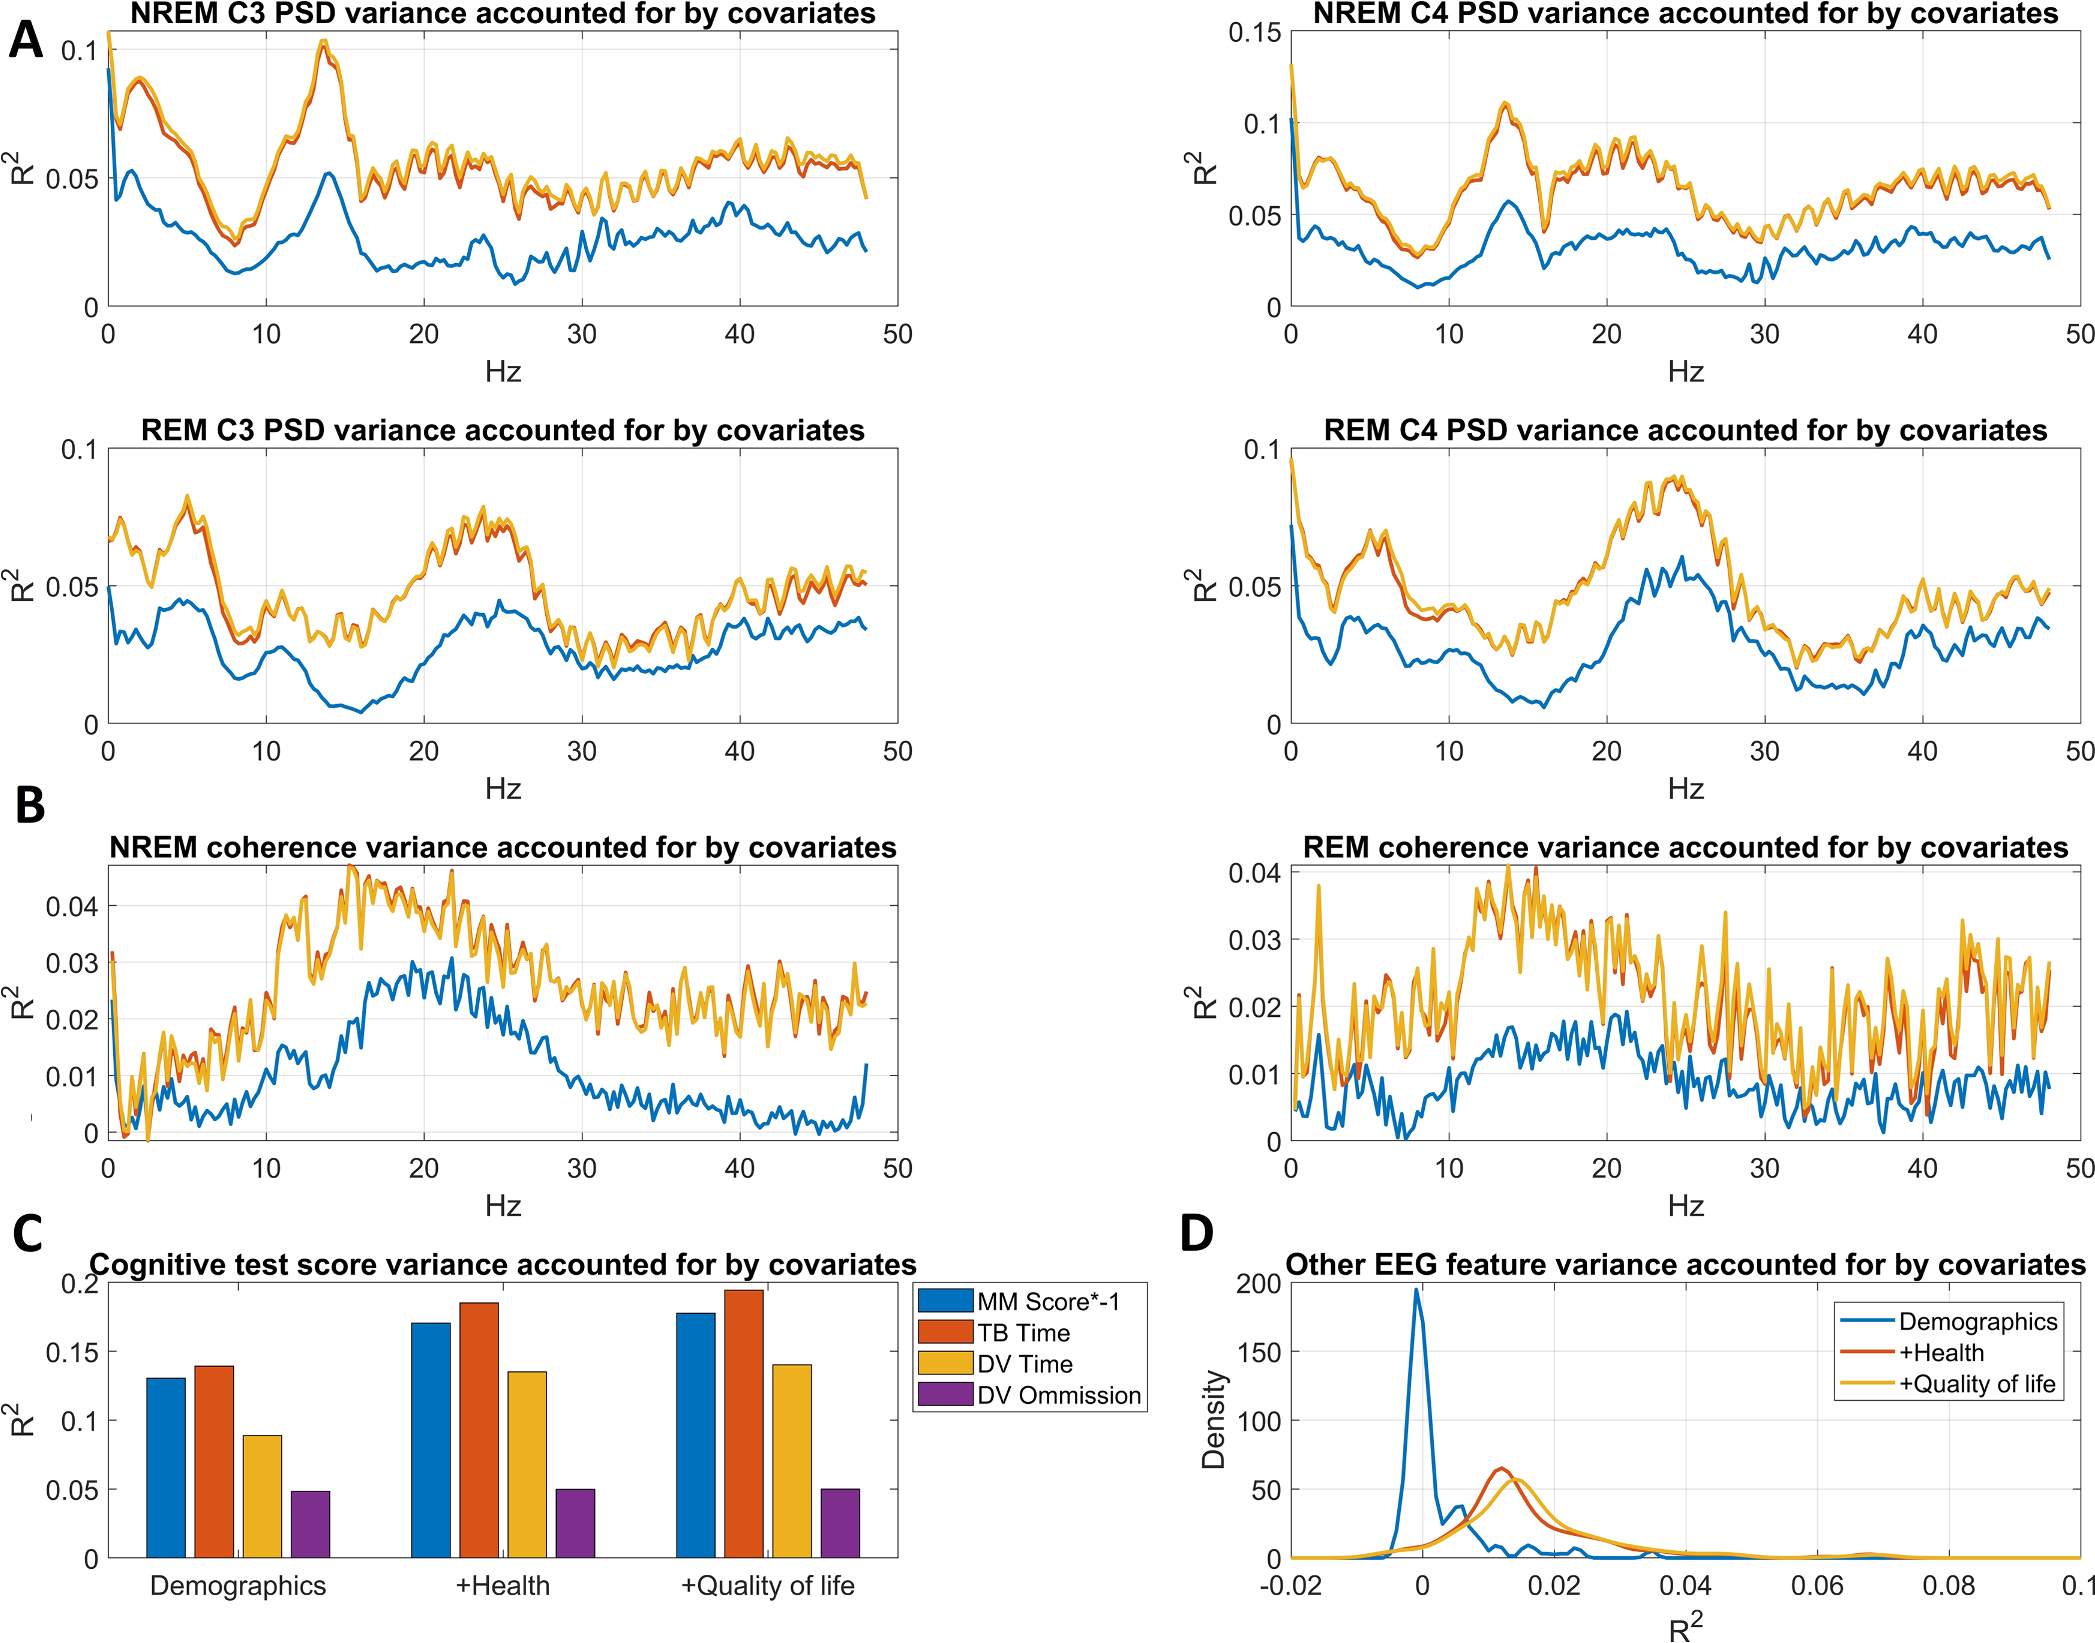
Fig. 2.

Variance accounted for by the three covariate sets (Model 2: demographic covariates added, Model 3: health covariates added, Model 4: quality of life covariates added). Panel A shows power spectral density variance accounted for as a function of frequency. Panel B shows wPLI variance accounted for as a function of frequency. Panel C shows variance accounted for in raw cognitive test scores. Panel D shows the distribution of R2 values across the 190 other EEG features. Note that the color codes used for the three models on this panel also apply for panels A and B.
