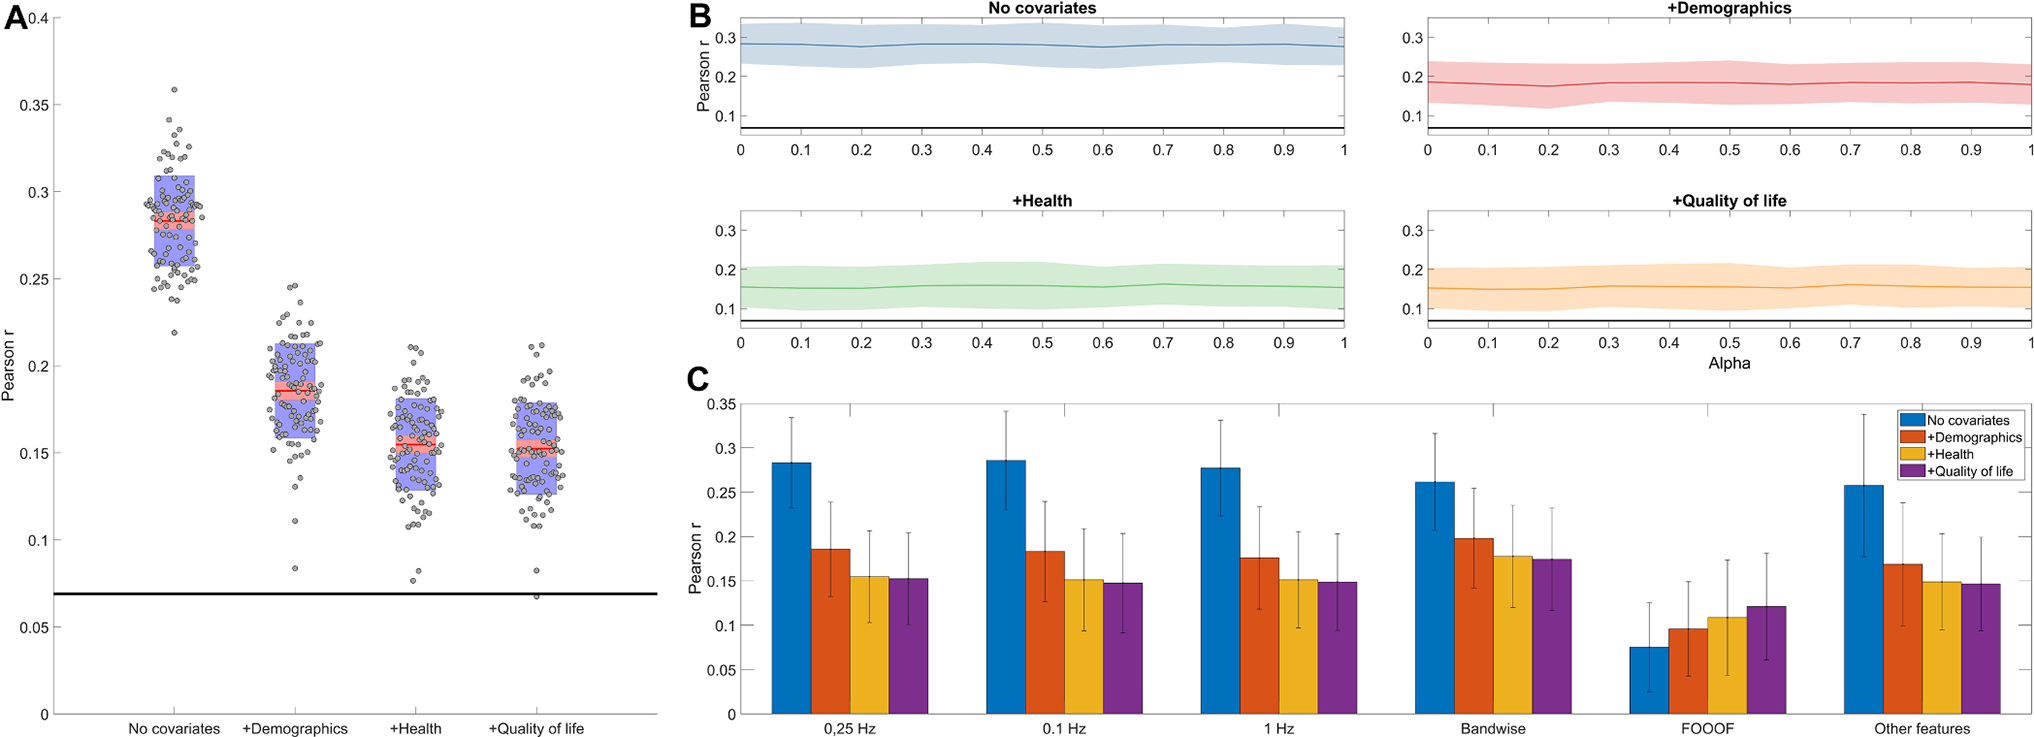
Fig. 4.

Panel A. EEG-based predictive validity (out-of-sample correlation between predicted and actual cognitive performance) for four increasingly strict covariate sets. Model 1 contains no covariates, Model 2 controls for demographic covariates, Model 3 adds controls for health covariates, while Model 4 adds controls for quality of life covariates. Red lines show the average performance across 100 model runs with random training-validation splits. gray dots show individual model runs. Red shading illustrates the standard error of the mean, while blue shading illustrates the standard deviation across model runs. A thick black line illustrates the critical correlation coefficient at the mean sample size of validation samples. Panel B: out-of-sample correlations between predicted and actual cognitive functioning as a function of regularization type and covariate choice. Regularization type is iteratively changed between alpha=0 (ridge regression), 0<alpha<1 (elastic net) or alpha=1 (LASSO). A thick black line indicates the critical correlation coefficient at the mean sample size of the validation samples. Shadings indicate empirical confidence intervals (1.96 standard deviations of the out-of-sample correlations calculated from 100 model runs). Panel C: model validity with different predictors sets: binwise PSD with three different spectral resolutions (0.1, 0.25 and 1 Hz), bandwise PSD, spectral parameters (intercept, slope, bandwidth, frequency and power of REM theta/beta and NREM sigma peaks) derived by FOOOF, and 0.25 Hz binwise PSD with the other EEG features (see Methods) added.
