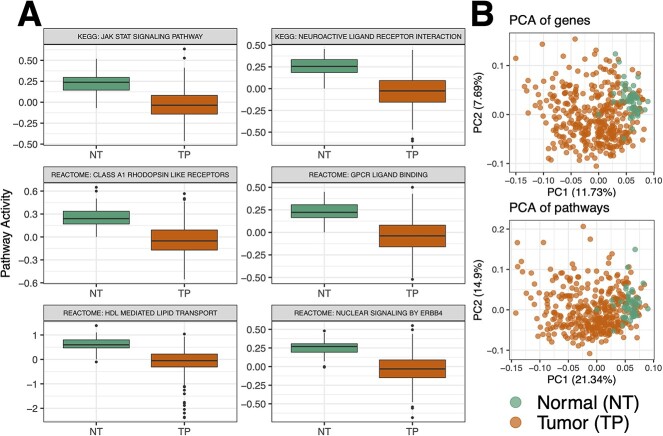
Figure 3.
Pathway activity analysis of the Liver Hepatocellular Carcinoma data set from the Cancer Genome Atlas. (A) Detection of differentially regulated liver cancer pathways by comparison of pathway activity profiles between normal tissues adjacent to tumors (NT) and tumor primary (TP) samples from TCGA data. Boxplots show the most significant differentially regulated pathways selected based on P-values of difference between NT and TP (Table 2). (B) Principal component analysis (PCA) projection of the samples based on either all genes or all pathways. Pathway summarization in PanomiR allows to analyze the activity of pathways in a continuum. PCA of pathways conserves sample groups and captures a higher variation compared to the PCA of genes.

