Figure 3.
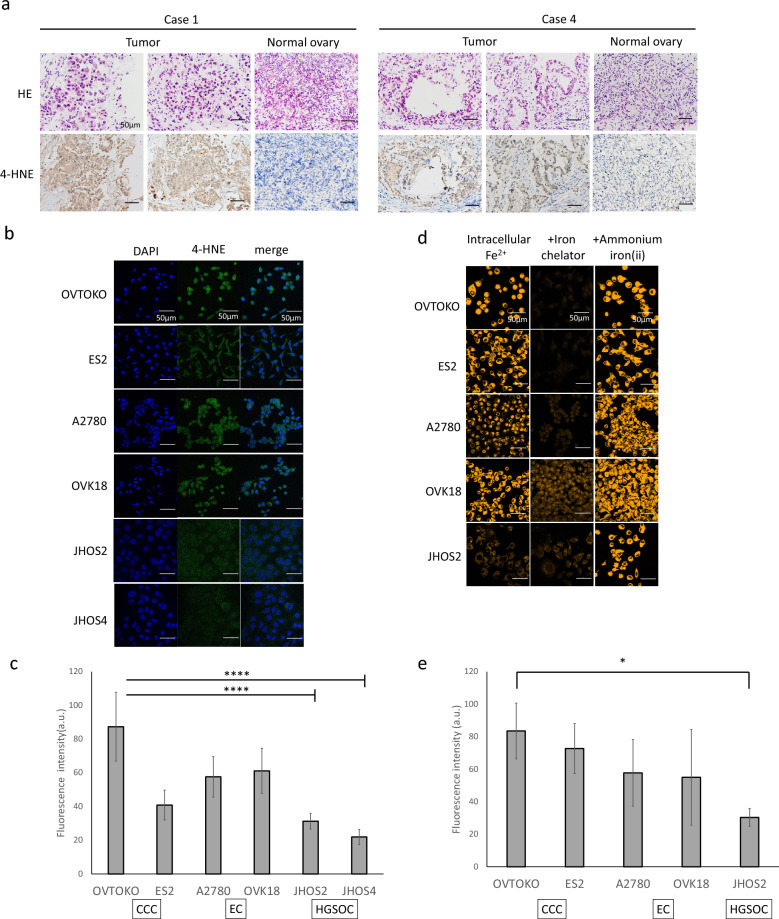
Lipid peroxide and intracellular iron accumulation in CCC. Representative images of CCC and normal ovary samples stained with H&E (top) and anti-4-HNE counterstained with hematoxylin (bottom) (a). Evaluation of 4-HNE accumulation in cell lines. Left: DAPI, center: 4-HNE, right: merge (b). Fluorescence intensity of 4-HNE (c); JHOS2 and JHOS4 had significantly lower fluorescence intensity than the 4 cell lines. Intracellular Fe2+ visualized by FerroOrange (left), addition of iron chelator (middle), and addition of ammonium iron (ii) (d). Intracellular Fe2+ fluorescence intensity in the basal line (e). Scale bar represents 50 µm.

