. 2023 Oct 17;5(23):6659–6669. doi: 10.1039/d3na00599b

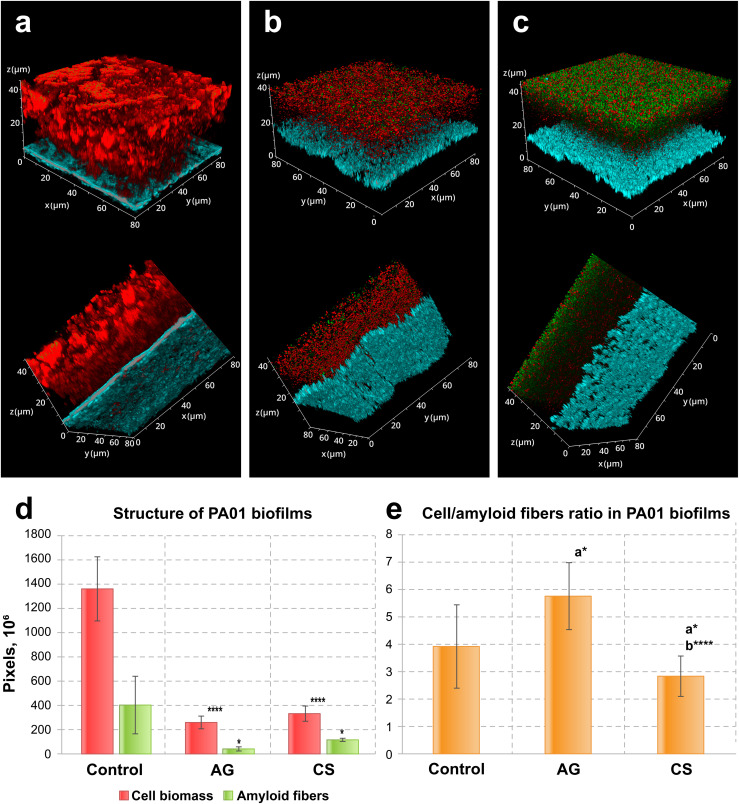
Fig. 2. Confocal laser scanning fluorescence images of three-day old biofilms of P. aeruginosa PA01 formed on (a) non-treated, (b) AG and (c) CS metal surfaces, (d) their structure and (e) the cell/amyloid biomass ratio. In (d and e), the y-axis shows the number of pixels in the signal of either the cell biomass (red) or the amyloid fibers (green), calculated after z-stacking serial CLSM images of biofilms; a* indicates statistical significance compared to control; b*** indicates statistical significance CS compared to AG with *p < 0.05, ****p < 0.001. Staining was performed with ethidium bromide to visualize cells and eDNA (red PL signal) and AmyGreen (green PL signal) to visualize amyloids, the blue signal is the reflected excitation light from the metal surface.

Fig. 2