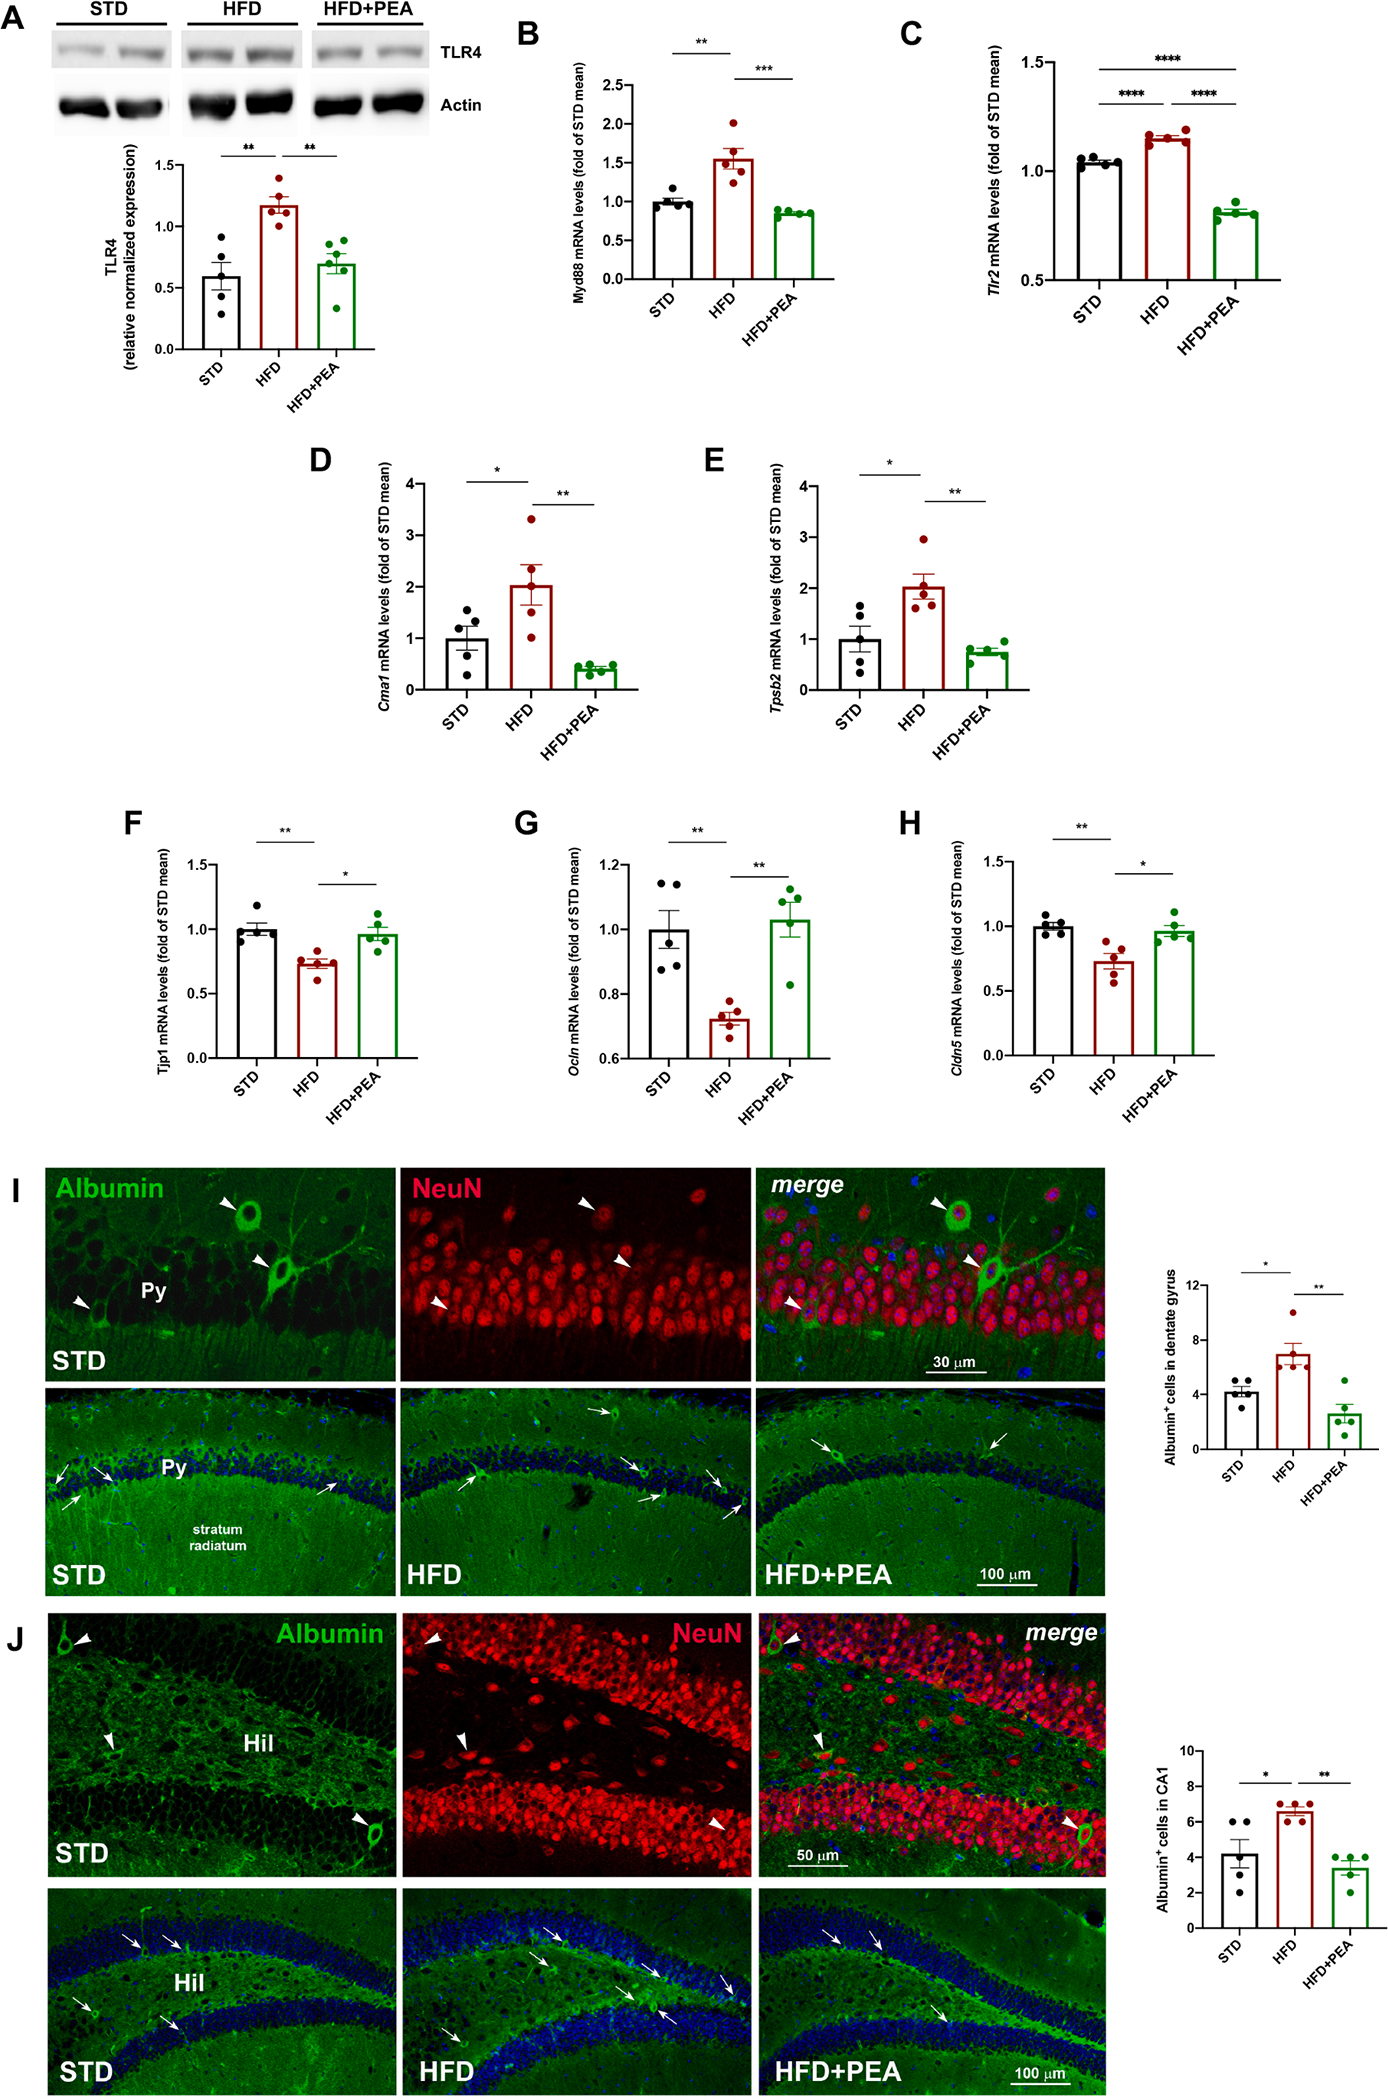
Fig. 6. The impact of PEA on immune activation, mast cell degranulation, and BBB integrity in the hippocampus of HFD mice.

Western blot for (A) TLR4, and Real-Time PCR analysis of (B) Myd88, and (C) Tlr2, (D) Cma1, (E) Tpsb2 (F) Tjp1, (G) Ocln, and (H) Cldn5 in the hippocampus of all experimental groups (at least n = 5 per group for western blot; n = 5 per group for Real-Time PCR). Morphometric analysis of albumin-immunoreactive cells in hippocampal (I) DG and (J) CA1 subfield. As shown in the upper panels of I and J, most albumin-positive cells (green, arrowheads) are also positive for the neuronal marker NeuN (red, arrowheads). The lower panels of I and J represent images depicting albumin staining in the DG and, respectively, CA1 subfield for each experimental condition. Hil, hilus; Py, pyramidal cell layer. In the merged images, cell nuclei are stained with TO-PRO3. The semiquantitative evaluation of albumin-positive neuronal-like profiles (n = 5 per group) is also shown. All data are shown as mean ± S.E.M. *p < 0.05, **p < 0.01, ***p < 0.001, ****p < 0.0001.
