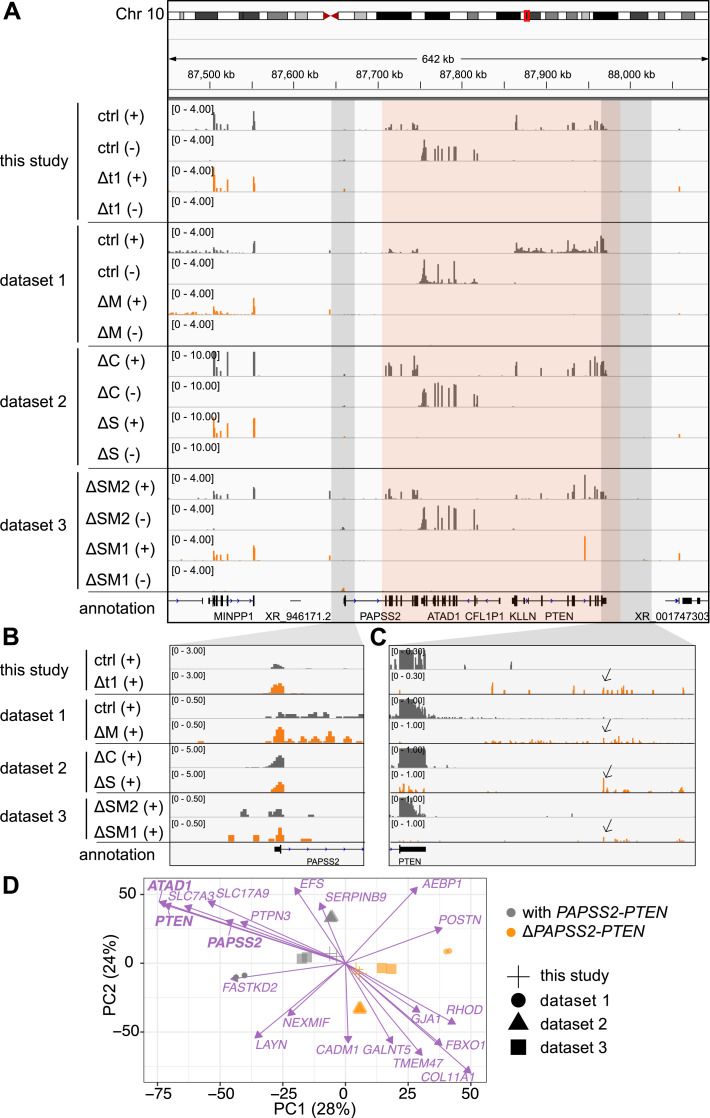
Figure 2. The unintended loss of the PAPSS2-PTEN locus resulted in similar transcriptional changes despite genotypical differences in CRISPR-Cas9–modified HAP1 cell clones.
(A, B, C) The hg38 genome browser view shows normalized RNA-seq coverage tracks for the plus (+) and minus (−) strand over the PAPSS2-PTEN locus (highlight in red box) for CRISPR-Cas9–modified (dark grey) and control (ctrl) HAP1 cell clones (orange) generated in this and other studies (dataset 1–3). (B, C) The (B) upstream and (C) downstream regions of the PAPSS2-PTEN locus (indicated as light grey boxes in Fig 2A) are magnified and visualized for the plus strand. Pol II read-through signals are indicated (arrows). (D) Factorial map of the principal component analysis after batch effect correction is shown for the top 20 genes (purple arrows) separating the HAP1 cell clones that contain (with, grey circle) or lost (Δ, orange circle) the PAPSS2-PTEN locus in our and other datasets (geometric shapes) in PC1 and PC2. The proportion of variance explained by each PC is indicated in parenthesis.

