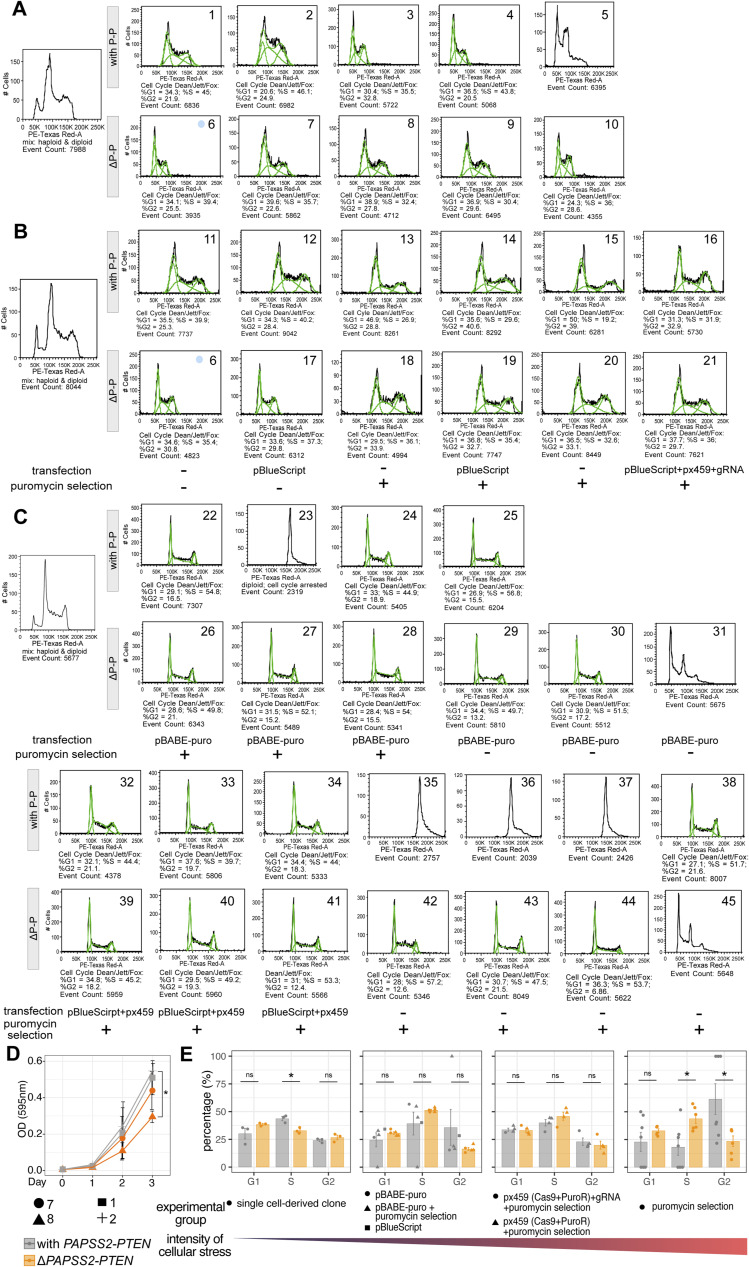
Figure S5. The genomic deletion of the PAPSS2-PTEN locus changed the cell cycle.
(A, B, C) Flow cytometry plots (gating for alive singlets) display cellular ploidy of individual cells of the HAP1 single-cell–derived clones with (P-P) or without (ΔP-P) the PAPSS2-PTEN locus. (A, B, C) All HAP1 cell clones displayed under (A) underwent neither plasmid transfection nor puromycin selection, whereas the panel of HAP1 cell clones obtained after (B, C) plasmid transfection and puromycin selection and only plasmid transfection or only puromycin selection. The experimental settings are labelled below the plots. A mixed population of haploid and diploid HAP1 cells was used as the reference to determine genome ploidy (left). Green lines indicate the event count and the number below each plot corresponds to the percentage of cells for each cell cycle phase (calculated by Dean/Jett/Fox model). (A, B) Clone 6 was analyzed twice (blue circle in (A, B)). (D) Line graph shows the relative number of metabolically active cells (assessed by optical density, OD) measured over 3 d after seeding by MTT assay (n = 2, mean ± SD). Geometric symbols represent the different experimental settings. Statistics: two-tailed t test. Significance codes: *0.01 < P < 0.05, insignificance is unlabeled. (E) The bar plots display the percentages of diploid HAP1 single-cell–derived clones (same as in Fig S4A–C) during the cell cycle phases. HAP1 cell clones are separated according to cellular exposure (left: mild, right: high cellular stress). Individual biological replicate (clone) is displayed. Statistics: two-tailed t test. Significance codes: *0.01 < P < 0.05; ns, not significant.

