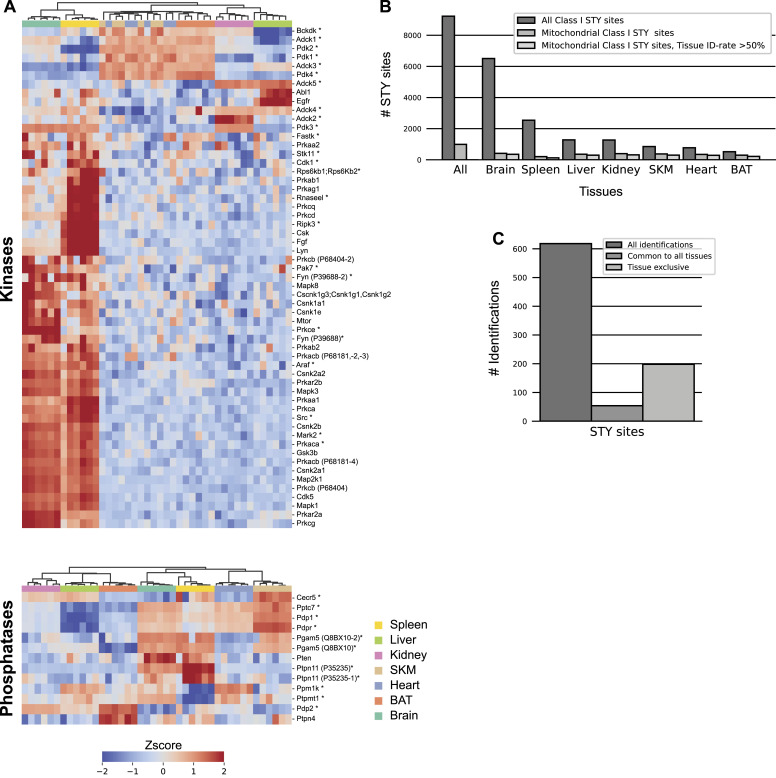
Figure 5. Tissue specificity of mitochondrial kinases and phosphatases.
(A) Z-scored protein abundances for predicted (triangle), known (star) (based on MitoCarta3.0 and IMPI database), and manually curated (SourceDataForFigure5) mitochondrial kinases (top) and phosphatases (bottom) across analyzed tissues. Skeletal muscle (SKM), brown adipose tissue (BAT). (B) STY site identification numbers. (C) Mitochondrial STY site numbers after filtering for mitochondrial STY sites identified in at least five out of six biological replicates in one tissue. Identification numbers for all identified STY sites (left), STY sites common to all tissues (middle), and STY sites exclusive to one tissue (right) are shown. Data in this figure are based on the analysis of six replicates (n = 6) for each tissue. Skeletal muscle (SKM), brown adipose tissue (BAT).
Source data are available for this figure.

