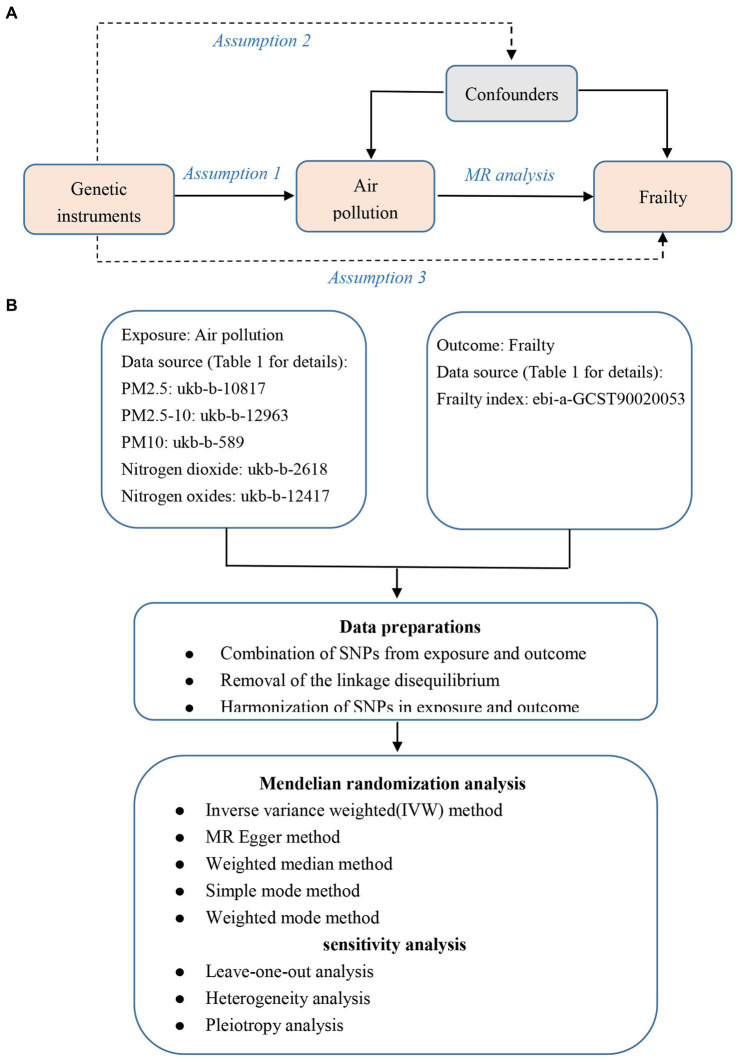
Figure 1.
The overview flowchart of hypothesis and schematic design. (A) Mendelian randomization key hypothesis Diagram. SNPs associated with air pollution were used as the genetic instruments for investigating the causal effect of air pollution on frailty. Line with arrows indicates that the genetic instruments (SNPs) are associated with the exposure and can only affect the outcome via the exposure. Dashed lines indicate that the genetic instruments (SNPs) are independent of confounders between the results. (B) Schematic design for the Mendelian randomization analysis.

