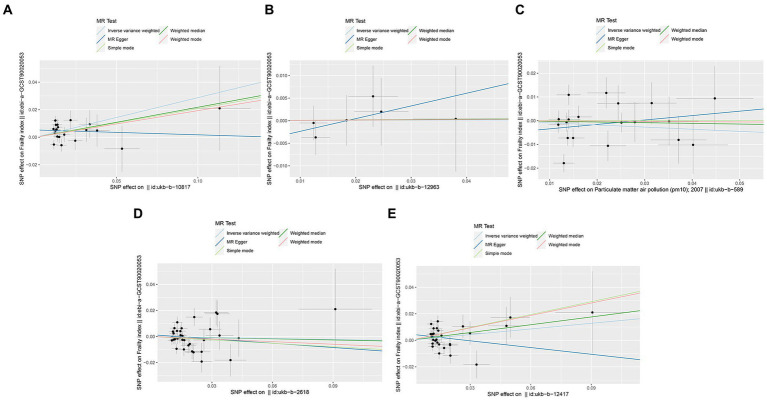
Figure 3.
Scatter plots of SNPs associated with air pollution and frailty. Each black point representing each SNP on the exposure (horizontal-axis) and on the outcome (vertical-axis) is plotted with error bars corresponding to each standard error (SE). The Mendelian randomization (MR) regression slopes of the lines represent the causal estimates using five approaches (inverse-variance weighted (IVW), MR-Egger, weighted median, simple mode, and weighted mode). (A) PM2.5. (B) PM2.5–10. (C) PM10. (D) Nitrogen dioxide. (E) Nitrogen oxides.

