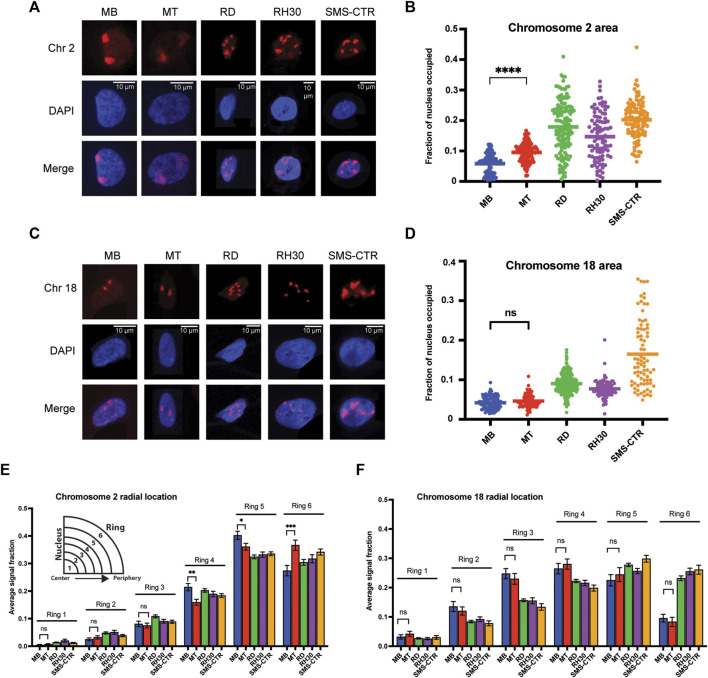
FIGURE 2.
Chromosome-specific differences in organizational characteristics with differentiation and in tumor cells. (A) Representative microscope images of myoblasts (MB), myotubes (MT) and rhabdomyosarcoma cell lines with chromosome 2 visualized through the hybridization of a chromosome paint. Images represent visualization of either the paint fluorophore (Chr 2), the nucleus (DAPI), or the merge of the above, as indicated to the side. (B) The area of the nucleus occupied by chromosome 2 was determined for each cell type, and is represented as a scatterplot, with each nucleus measured represented as a single point, and the mean represented by the horizontal bar. Statistical testing is shown only for the MB to MT comparison and demonstrates a significant increase in area occupied by chromosome 2 in the differentiated cells. (C) Representative microscope images for chromosome 18 visualization as in 2A. (D) Plots of the area of the nucleus occupied for chromosome 18, as in 2B. Statistical testing of the means of MBs and MTs demonstrated no significant difference in area occupied. (E) Graphing of the average fraction and SEM of chromosome 2 fluorescent signal present in each one of six concentric nuclear rings (ring 1: most central, ring 6: most peripheral) demonstrates that in all cell types analyzed, chromosome 2 had little presence in the inner rings compared to the outer rings, and that there was a shift to increased signal presence in the outermost ring with differentiation from MB to MT. (F) Graphing, as in 2E, of the average fraction of chromosome 18 fluorescent signal in each of six concentric nuclear rings demonstrates more central localization compared to chromosome 2, and no difference in radial localization with the process of differentiation. ns: not significant; *: p < 0.05; **: p < 0.01; ***: p < 0.001; ****: p < 0.0001. n = 100–143 nuclei per cell type for chromosome 2; 78–270 nuclei for chromosome 18.

