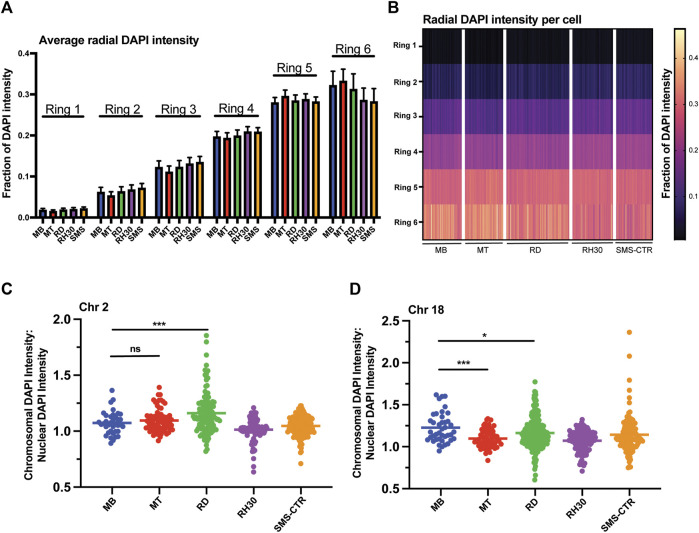
FIGURE 3.
Myogenic and RMS cells exhibit similar overall DNA density patterning, but cell- and chromosome-specific differences in chromosome DNA density. (A) DAPI intensity in nuclei as a function of radial distance is shown divided up across six concentric nuclear rings, where ring 1 is the innermost portion of the nucleus and ring 6 the most peripheral. Each bar represents the average intensity for a given cell type in a given ring, with error bars indicating the standard deviation. (B) The data from 3A shown here as a heat map, with each column representing a single individual nucleus. (C) A scatterplot depicting the ratio of the DAPI intensity of the region of the nucleus occupied by chromosome 2 relative to the normalized DAPI intensity of the whole nucleus for each cell type as indicated. Each point represents a single chromosome, the mean is indicated by the horizontal line. (D) A scatterplot depicting chromosome 18-specific DAPI intensity relative to normalized nuclear DAPI intensity as in 3C. Statistical testing done by t-tests with unequal variance. ns: not significant; *: p < 0.05; ***: p < 0.001; n = 96–167 nuclei per cell type for A and B; n = 37–167 chromosomes per cell type for chromosome 2; 41–228 chromosomes for chromosome 18 for C and D.

