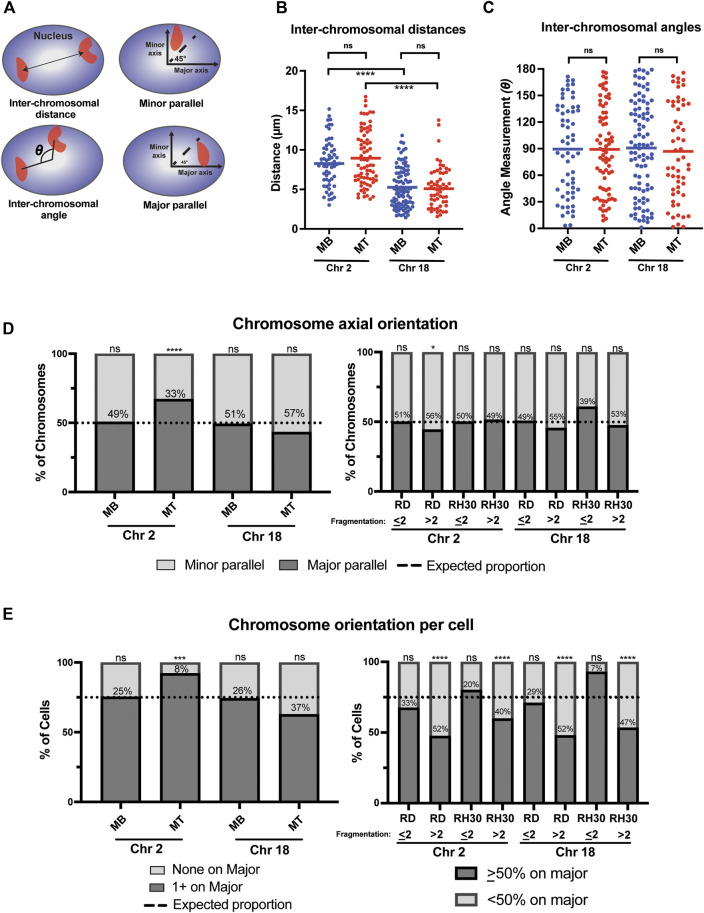
FIGURE 4.
A chromosome-specific change in positioning relative to the nuclear axis occurs with normal myogenic differentiation and is absent in rhabdomyosarcoma cells. (A) Diagrammatic depictions of inter-chromosomal distance, inter-chromosomal angle, and minor and major parallel of chromosomal signal. (B) A scatterplot representing the inter-chromosomal distance between the centroids of either chromosome 2 or chromosome 18 (indicated below) in the nuclei of either myoblasts (MB) or myotubes (MT). Each point represents the measurement in a single nucleus, and the horizontal line represents the mean. (C) The scatterplot shows the inter-chromosomal angle for the same nuclei and chromosomes as measured in 4B. (D) Bar graphs that indicate the percentage of all measured chromosomes for an indicated cell type that were assigned either as being associated with the minor axis (minor parallel) or the major axis (major parallel), as depicted in 4A. The dotted line indicates the expected proportion of chromosomes that would be found associated with a given axis if they were organized in space at random. (E) Bar graphs for the same cells and measurements as in 4D, but with the calculation done as the orientation of the chromosomes in each individual nucleus. Nuclei in normal cells were classified either as having no chromosomes assigned to the major axis (none on major) or at least 1 chromosome assigned to the major axis (1 + on major). In tumor cells, cells were grouped as either having <50% of their identified chromosomal signals on the major axis, or ≥50% of chromosomal signals on the major axis. As in 4D, the dotted line indicates where the expected division would be between the two classifications if each chromosome was randomly positioned in nuclear space. In both D and E, the number within the bars indicates the value assigned to the minor parallel for each condition. Statistical testing in B and C was by t-tests with unequal variance; D and E was by using a binomial test to compare observed count frequencies. ns: not significant; *: p < 0.05; ***: p < 0.001; ****: p < 0.0001; n = 55–93 nuclei per cell type: chromosome pairing in B and C; n = 80–140 nuclei per cell type for chromosome 2 in D and E; n = 60–220 nuclei per cell type for chromosome 18 in D and E.

