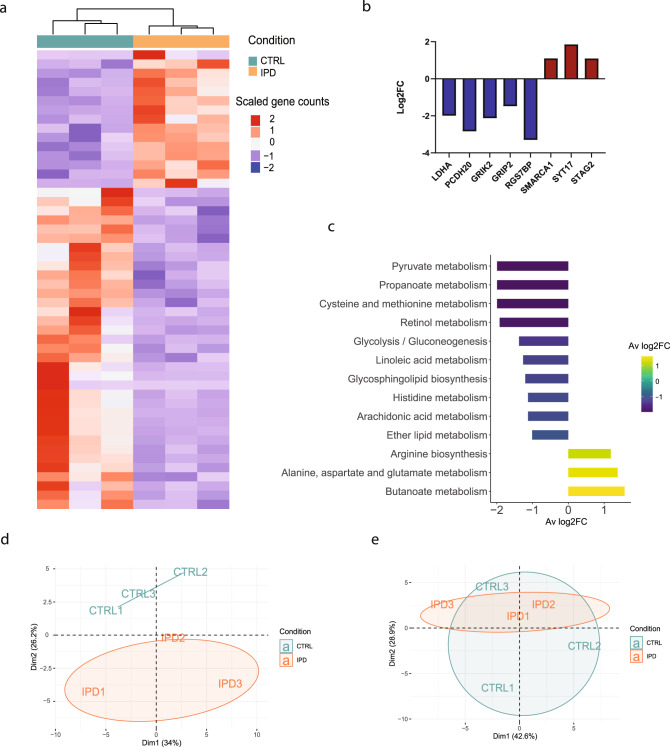
Fig. 1. Transcriptomic and metabolic profiles reveal neurodevelopmental and metabolic alterations in IPD neural precursor cells.
a Heatmap of scaled gene counts of significantly differentially expressed genes (p < 0.05) between IPD and control NESCs. b Log2FC of the top significantly expressed genes (FDR < 0.05) displaying gene expression difference in IPD NESCs compared to control cells. c The most dysregulated metabolic pathways, selected by the average of Log2FC < −1 or >1 of genes annotated in each pathway. The color represents the Log2FC. d Principal component scores plot of non-polar metabolites detected by untargeted GC-MS analysis. e Principal component scores plot of polar metabolites detected by untargeted GC-MS analysis.

