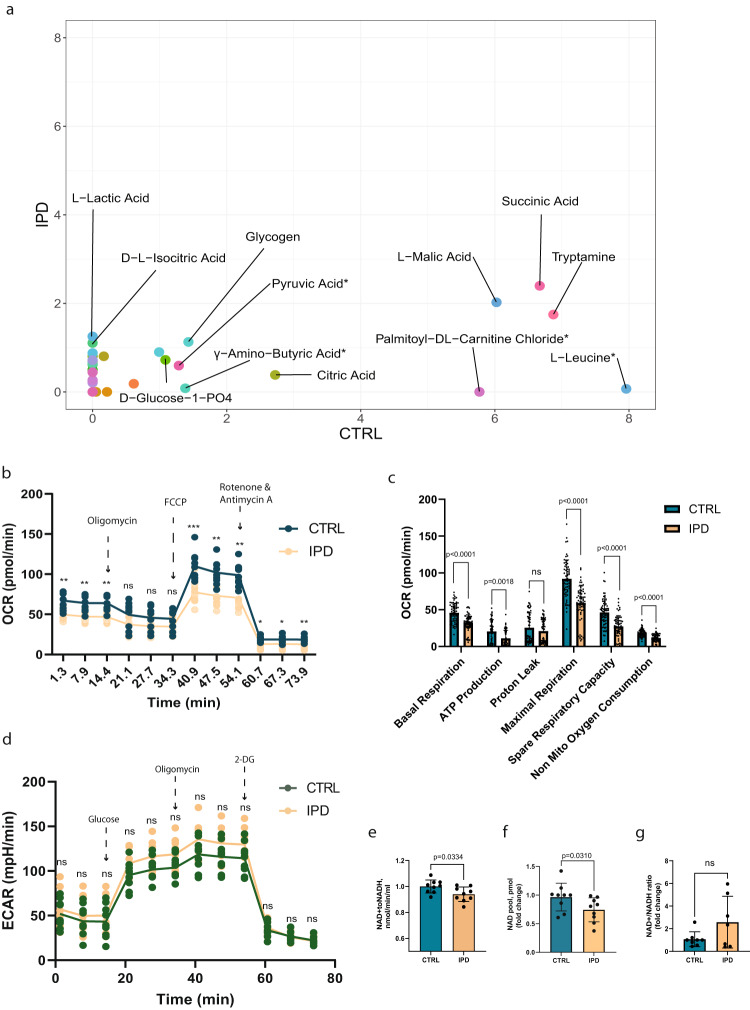
Fig. 2. IPD neural precursors show reduced ability to metabolize various metabolic substrates and impaired mitochondrial respiratory capacity.
a Scatter plot of the maximal metabolic rate of different substrates. Each dot represents a unique substrate placed in the plot according to the metabolic rate by which it has been metabolized by the IPD (y-axis) and control (x-axis) NESCs. The maximal metabolic rate is normalized by background subtraction and cell density in the respective well. The median rate between the three lines of each condition is considered. Substrates metabolized with the normalized maximal rate above 1 are labeled. b Oxygen consumption rate (OCR) over time representing mitochondrial respiratory capacity. Basal respiration is measured until the injection of oligomycin which inhibits complex V activity, resulting in a decrease in respiration, which is linked to ATP production. FCCP injection disrupts ATP synthesis and mitochondrial membrane potential, allowing measurement of maximal respiration and spare respiratory capacity. The final injection is a mixture of complex I and complex III inhibitors—rotenone and antimycin A. Here mitochondrial respiration is shut down, enabling the calculation of nonmitochondrial respiration. Statistics: unpaired t-test. Significance asterisks represent *P < 0.05, **P < 0.01, ***P < 0.001. Error bars represent mean + SD. N = 3 independent experiments. c Bar graphs of mitochondrial respiratory capacity features. Statistics: non-parametric Mann-Whitney test. Error bars represent mean + SD. N = 3 independent experiments, each data point represents a measurement of a single well of the assay. d Extracellular acidification rate (ECAR) over time representing glycolytic function. Before glucose injection, ECAR shows non-glycolytic acidification caused by processes in the cell other than glycolysis. The first injection of glucose enables measurement of the rate of glycolysis under basal conditions. The second injection of oligomycin, a complex V inhibitor, enhances the energy production via glycolysis, revealing the maximum glycolytic capacity. The final injection of 2-deoxy-glucose (2-DG), a glucose analog that inhibits glycolysis, allowing to measure glycolytic reserve. N = 3 independent experiments. e Pyruvate dehydrogenase activity measured based on nmol of generated NADH from NAD+ over time, which is proportional to enzyme activity. Statistics: non-parametric Mann-Whitney test. Error bars represent mean + SD. N = 3 independent experiments. f Total pool of NAD (NAD+ and NADH) concentration in pmol relative to the control samples. Statistics: non-parametric Mann-Whitney test. Error bars represent mean + SD. N = 3 independent experiments. g NAD+/NADH ratio relative to the control samples. Statistics: non-parametric Mann-Whitney test. Error bars represent mean + SD. N = 3 independent experiments.

