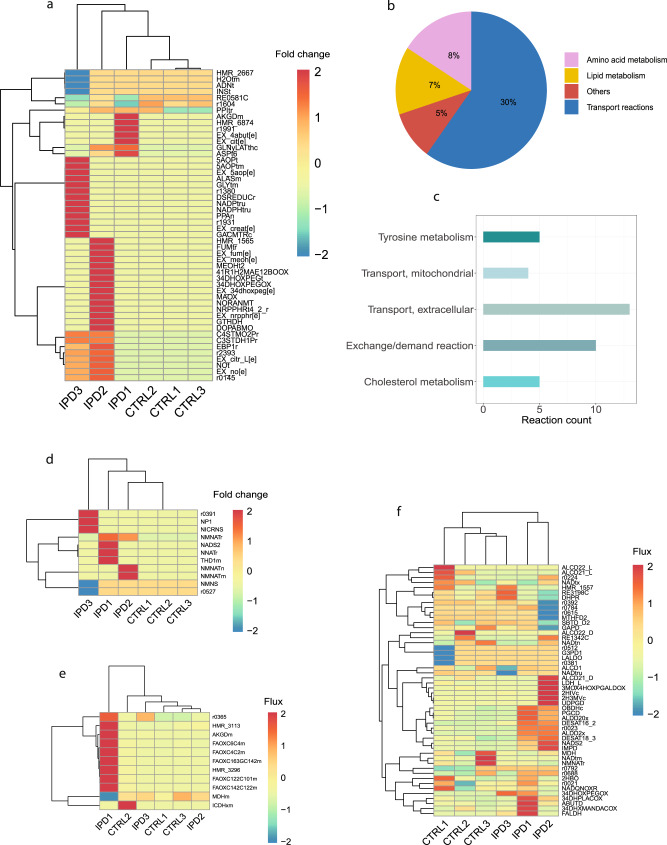
Fig. 3. Metabolic modeling.
a Unsupervised clustering of the top 50 reactions with the greatest fold change of flux relative to the mean flux of control models. Flux distribution was determined using eFBA. b Metabolic pathways to which the top 50 reactions are assigned, demonstrating the percentage of the top 50 reactions belonging to each pathway. c The top five subsystems with the highest reaction count were determined by assigning the top 50 most changed reactions to the Recon 3D subsystems. d Unsupervised clustering of NAD+ metabolism reactions based on the fold change of flux relative to the mean flux of control models. Flux distribution was determined using eFBA. e Unsupervised clustering of estimated flux for the NAD+ involving reactions in the mitochondria. Flux distribution was determined using eFBA. f Unsupervised clustering of estimated flux for the NAD+ involving reactions in the cytosol. Flux distribution was determined using eFBA.

