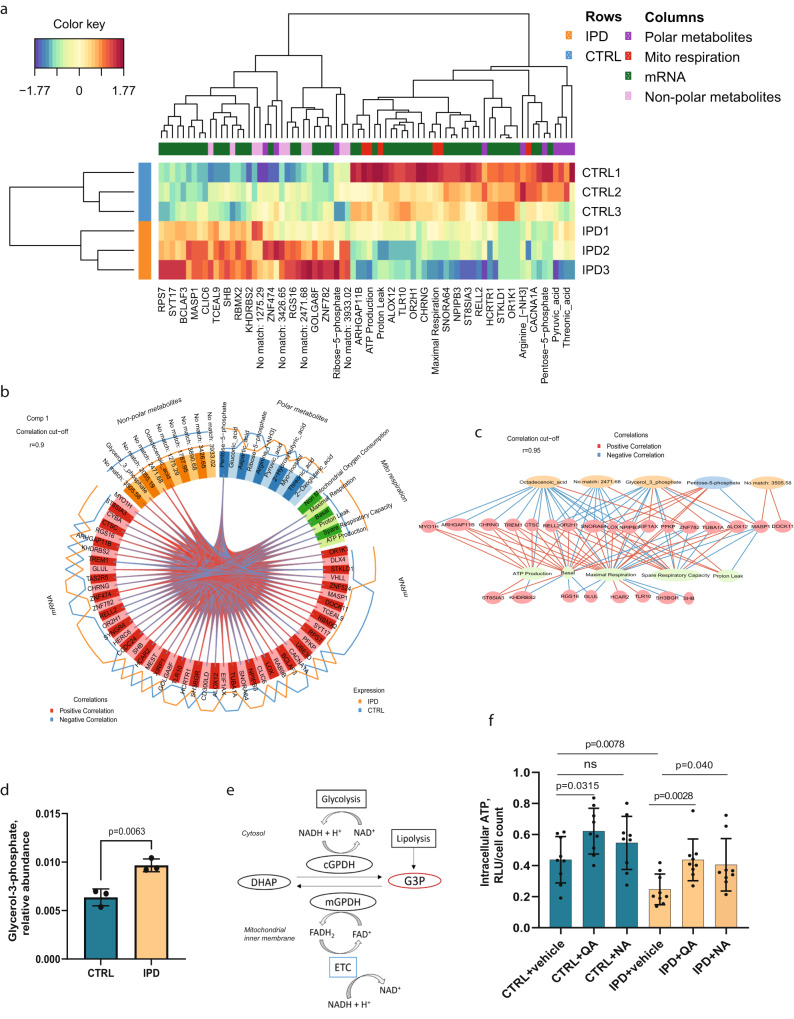
Fig. 4. Data integration.
a Heatmap of the top discriminant features between the IPD and control NESCs. b Circos plot showing the correlation between features contributing to the variation of the component 1. Correlation threshold: r = 0.9. c Correlation network of features contributing to the variation of the component 1. Correlation threshold: r = 0.95. d Relative abundance of glycerol-3-phosphate. Statistics: Welch’s t-test. Error bars represent mean + SD. N = 3 biologically independent samples. e Graphical representation of glycerol-3-phosphate (G3P) as an intermediate metabolite in glycolysis, lipid metabolism and oxidative phosphorylation and its role in NAD metabolism. G3P synthesis from dihydroxyacetone phosphate (DHAP) by cytosolic glycerol-3-phosphate dehydrogenase (cGPDH) regenerates cytosolic NAD+ from the NADH that is generated by glyceraldehyde-3-phosphate dehydrogenase in glycolysis. The G3P shuttle also facilitates electron transport between cytosol to mitochondria. Flavin linked mitochondrial glycerol-3-phosphate dehydrogenase (mGPDH) oxidases G3P at the same time reducing flavin adenine dinucleotide (FAD) to FADH2 and transferring electrons to ubiquinone pool of the electron transport chain (ETC). ETC oxidazes NADH generated in TCA to replenish the mitochondrial NAD+ pool. G3P can also be produced from glycerol, which is the end product of lipolysis. f Intracellular ATP levels measured in relative light units (RLU) and normalized to the cell number in samples treated with vehicle, 20 nM quinolinic acid (QA) and 5 mM nicotinic acid (NA). Statistics: non-parametric Mann-Whitney test. Error bars represent mean + SD. N = 3 independent experiments.

