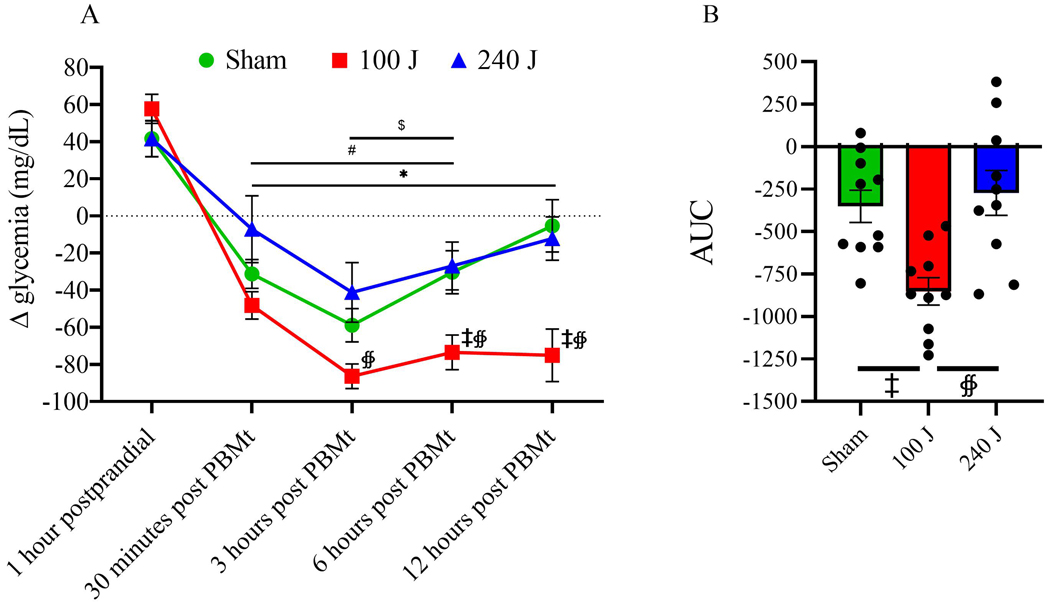
Figure 4A –
Change in glycemia response (delta) after the standardized meal (1 hour postprandial), and 30 min, 3, 6, and 12 hours after 0 J (sham), 100 J or 240 J of photobiomodulation therapy (PBMt), in type 2 diabetes patients without oral hypoglycemic medication (n=10). Values are average and standard error of the mean. 4B – Area under the curve (n=10). Values are arbitrary units. Within group comparison vs 1 hour postprandial: #p<0.05 for sham, *p<0.05 for 100 J, $ p<0.05 for 240 J. Between groups comparisons: ‡ p<0.05 vs sham, ∯ p<0.05 vs 240 J.

