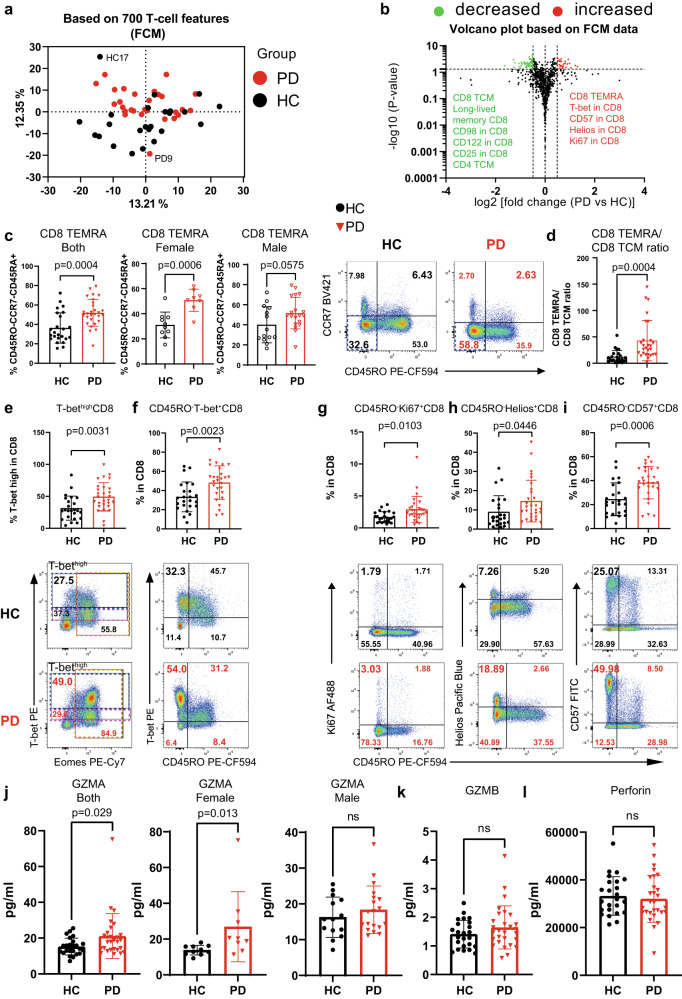
Fig. 2. Early-to-mid stage iPD exhibits an increased effector profile in CD8 T cells.
a PCA plot showing a distinct immunological fingerprint of PD vs HC based on T-cell combinatorial features using the FCM analysis. b Volcano plot showing the most significantly (p < 0.05, fold change >1.4) decreased and increased subpopulations in PD vs HC. The horizontal dashed line corresponds to the value of 1.3 (p = 0.05), while the two vertical dashed lines correspond to the log2 value of −0.485 or 0.485 (fold change of 1.4). c Scatter dot plots (left) and representative FCM plots (right) showing the increase in CD8 TEMRA (CD45RO−CD45RA+CCR7−, the simplified gating strategy for TEMRA) for all (left) or females (middle) or males (right). The TEMRA gate was highlighted in blue dashed rectangle in FCM plots. The combination of markers used to define TEMRA was described in the y-axis title. d Scatter dot plots showing the ratios between CD8 TEMRA and CD8 TCM (CD45RO+CCR7+CD27+). e-i Scatter dot plots (upper) and representative FCM plots (lower) showing the frequency of T-bethigh (e), CD45RO−T-bet+ (f), CD45RO−Ki67+ (g), CD45RO-Helios+ (h) and CD45RO-CD57+ (i) among CD8 T cells. In e, blue and magenta dashed rectangle highlights T-bethigh and T-betmid cells, respectively, while gold dashed rectangle shows Eomes+ cells. The percentage of the interest was enlarged. j–l Serological levels of GZMA (j) for all (left) or females (middle) or males (right), GZMB (k) and perforin (l). The results in b–i were analyzed using unpaired two-tailed Student’s t test while the results in j–l were analyzed using unpaired two-tailed Mann–Whitney nonparametric test without adjustments for multiple comparisons. Data are presented as mean ± standard deviation (s.d.). Each symbol represents the measurement from one individual (c–l). ns or unlabeled, not significant; all significant P-values are indicated. HC healthy controls, n = 24; PD, patients with Parkinson’s disease, n = 28; FCM flow cytometry; GZMA/GZMB Granzyme A/B, TCM central memory. For c, d, j, female HC, n = 10; female PD, n = 8; male HC, n = 14; male PD, n = 19. Source data are provided as a Source Data file.

