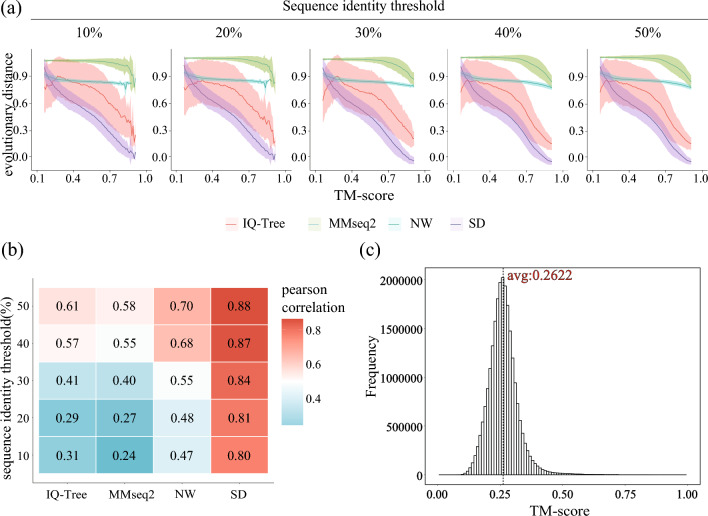
Figure 2.
Correlation between the evolutionary distance and structural similarity. (a) The correlation between evolutionary distances and TM-score with varying sequence identities. The line reflects the mean distance, and the shadow reflects the standard deviation. (b) The absolute values of the Pearson correlation were calculated for each distance under a series of sequence identity thresholds. (c) The distribution of TM-scores in the superfamily dataset.

