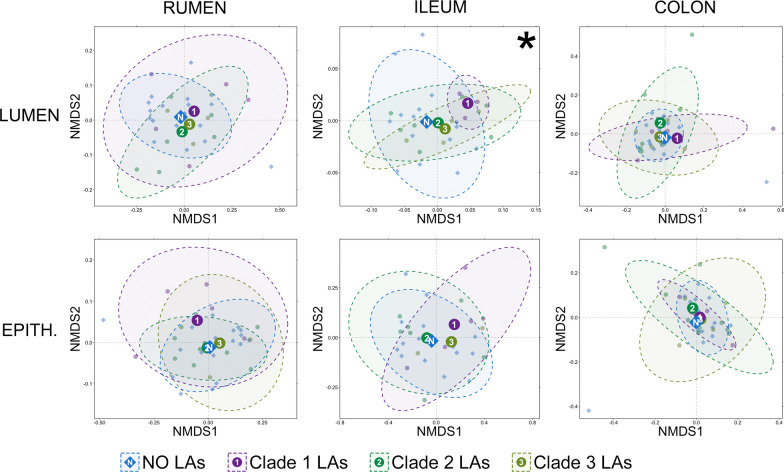
Fig. 10.
Non-metric multidimensional scaling (NMDS) of generalized UniFrac distances illustrating differences in overall composition of luminal and epithelial microbial communities in the rumen, small intestine, and and large intestine. The NMDS demonstrates clustering of 16S rRNA gene sequences from animals that had no liver abscesses (blue), had liver abscesses classified as clade 1 (Fusobacteriaceae dominant; purple), clade 2 (high Bacteroidaceae; sea green), or clade 3 (high diversity; olive green). The large opaque points represent the centroid for each liver abscess community type, while the smaller and more transparent points represent the individual animals within each group. Dashed lines and shaded areas represent 90% confidence intervals for each liver abscess community type. There was a significant difference in small intestine luminal communities between animals with no liver abscesses and animals with clade 1 (Fusobacteriaceae dominated) abscesses (PERMANOVA, n = 3–15, p < 0.05)

