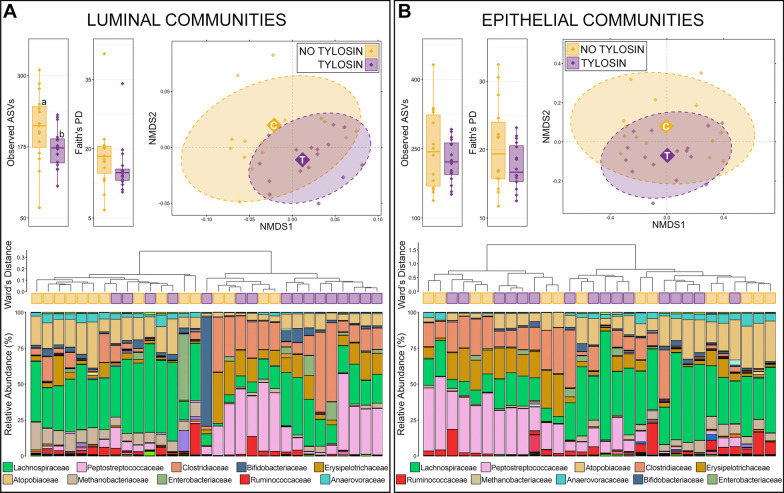
Fig. 3.
Alpha and beta-diversity in luminal and epithelial microbial communities of the small intestine between animals that received tylosin supplementation and those that did not. Boxplots demonstrate differences in observed amplicon sequences variants (ASVs; richness) and Faith’s phylogenetic diversity. Luminal communities from the ileum of animals receiving tylosin were significantly less rich that those that did not (Kruskal–Wallis analysis of variance, p < 0.05, n = 15–19). Non-metric multidimensional scaling (NMDS) of generalized UniFrac distances illustrates differences in overall microbial community structure between treatment groups. The NMDS demonstrates clustering of 16S rRNA gene sequences from animals that received tylosin (purple) and those that did not (gold). The large opaque points represent the centroid for communities from each treatment group, while the smaller and more transparent points represent the individual animals within each group. Dashed lines and shaded areas represent 90% confidence intervals. Tylosin supplementation resulted in significant differences in the overall composition of luminal communites but not epithelial communities of the small intestine (PERMANOVA, p > 0.05, n = 15–19). Dendrogram displaying the relatedness of luminal and epithelial communities in the large intestine based on normalized ASVs. Hierarchal clustering was performed on generalized UniFrac distances using Ward’s agglomeration method. Purple boxes represent communities from animals that received tylosin supplementation and gold boxes represent communities from animals that did not. The bar plot illustrates the relative abundance of microbial families with each individual sample. The 10 most abundant families are displayed in the legend

