
FIGURE 5.
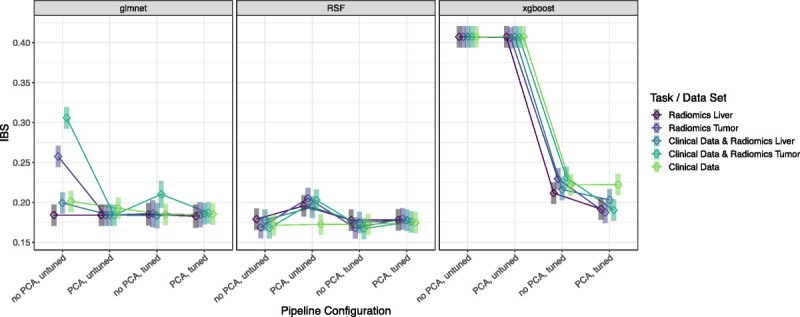
Interaction-style plot with ◇ = estimated marginal means (EMMs) and ▍ = simultaneous confidence intervals (CIs) of the linear mixed model (LMM). This LMM models, the IBS of the benchmark results via the predictors data set and pipeline configuration, and their interaction, along with the training/test CV fold as random effect.