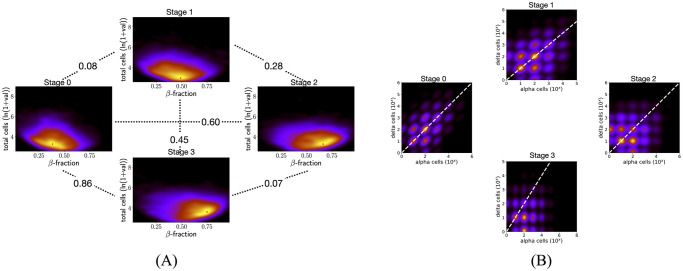
Fig 2. Comparing cell composition across developmental stages.
(A) KDE plots of the distribution of islets characterized by the total number of cells and β-cell fraction from stage 0 to stage 3. The number between every pair of plots shows the KL-divergence between respective KDEs. The KL-divergence between stages 0 and 1 and between 2 and 3 are at most 0.07 as compared to at least 0.27 for every other pairwise comparison. The mode of the density estimate is marked by a red star in each plot. Peaks are at (0.38, 3.27), (0.49, 2.95), (0.66, 3.27), and (0.75, 3.6) for stages 0 to 3. A higher proportion of islets in the last two stages have a higher β-cell fraction. (B) KDE plots of distribution of islets characterized by number of α and δ-cells. In the later developmental stages (2 and 3) there is a large proportion of islets with more α-cells than δ-cells (bright regions in the KDE under the y = x white dashed line).

