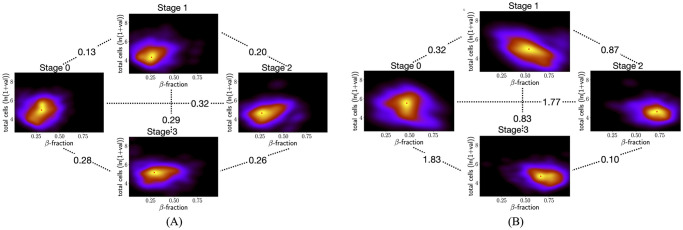
Fig 4. Comparing KDEs of distributions of islets from developmental data set with (A) at least one NS β-comp inside an αδ-cycle and (B) at least one NS αδ-comp inside an β-cycle.
Stages 0 to 3 in clockwise from the left-most plot for stage 0. Peaks in (A) are at (0.31, 4.95), (0.26, 4.31), (0.27, 4.63), and (0.29, 5.14) and in (B) are at (0.47, 5.53), (0.54, 4.95), (0.72, 4.63), and (0.66, 4.69), for stages 0 to 3.

