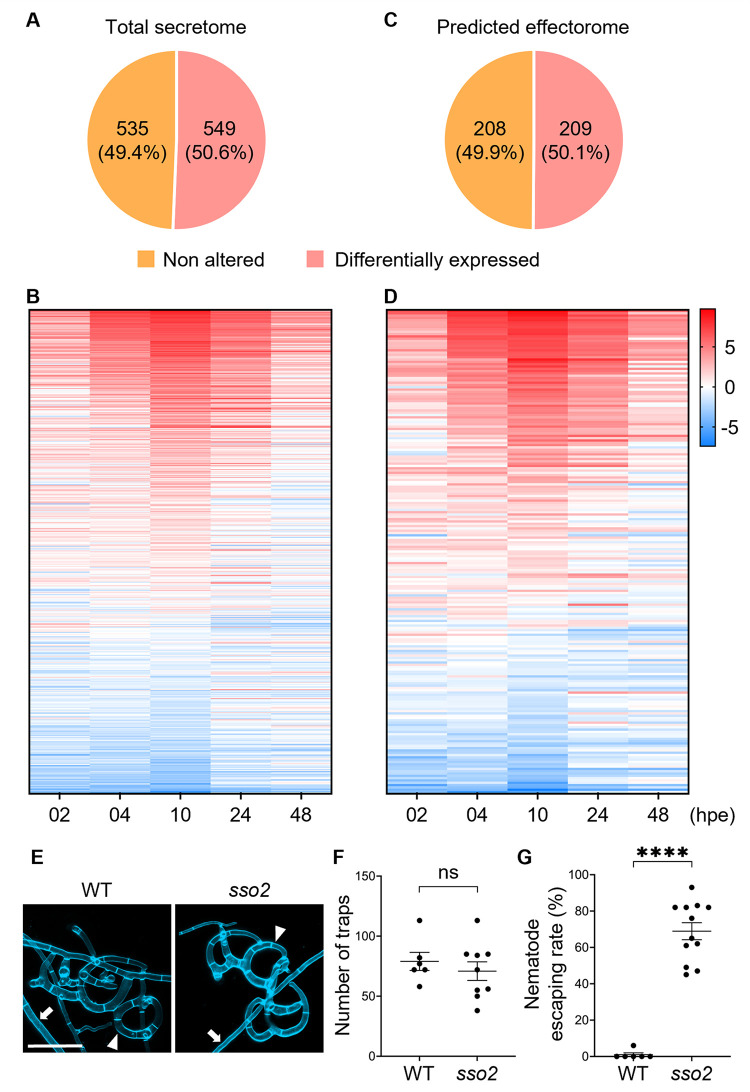
Fig 3. A. oligospora‘s response to C. elegans is dependent on protein secretion.
(A-D) Percentage and expression pattern analysis of the predicted secretome (A, B) and effectorome (C, D) that showed differential expression upon exposure to C. elegans. The data underlying this Figure can be found in S1 Data. (E) High-resolution image of traps stained by SR2200. Images were taken 24 h after induction (scale bar, 50 μm). The arrowhead indicates the trap cell; the arrow indicates vegetative hyphae. (F, G) Quantification of trap numbers (F) induced by exposure to 30 C. elegans nematodes and nematode escaping rate. (G) Among trapping of 50 C. elegans (mean ± SEM). The data underlying this Figure can be found in S1 Data.

