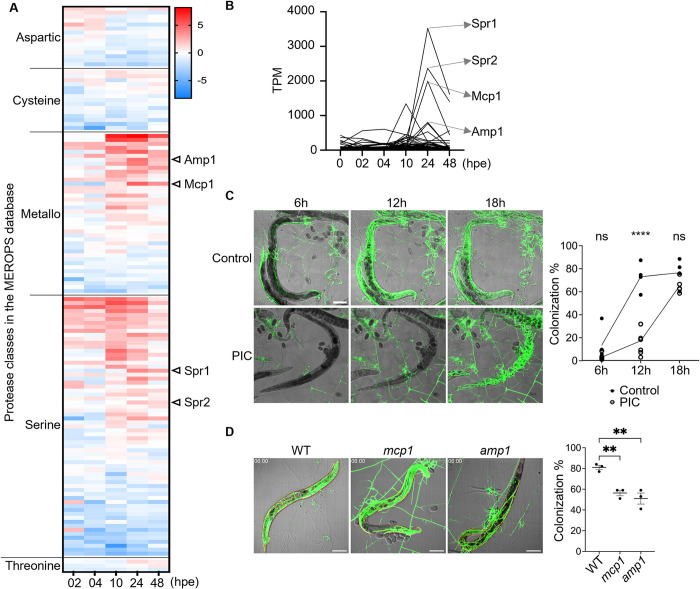
Fig 5. Late time point induced protease and its potential role in digesting nematodes.
(A) Expression profiles of differentially expressed protease transcripts upon exposure to C. elegans. The data underlying this Figure can be found in S1 Data. (B) TPM of the differentially expressed proteases. Arrows indicate the 4 highly up-regulated proteases. The data underlying this Figure can be found in S1 Data. (C) Image and quantification of hyphal colonization after penetration for 6–18 h and treatment with 1× PIC (scale bar, 100 μm). The data underlying this Figure can be found in S1 Data. (D) Image and quantification of hyphal colonization in C. elegans after being captured by traps for 6 h in WT, mcp1, and amp1 (scale bar, 100 μm). The data underlying this Figure can be found in S1 Data. hpe, hours post-exposure; PIC, protease inhibitor cocktail; TPM, Transcript Per Million; WT, wild type.

