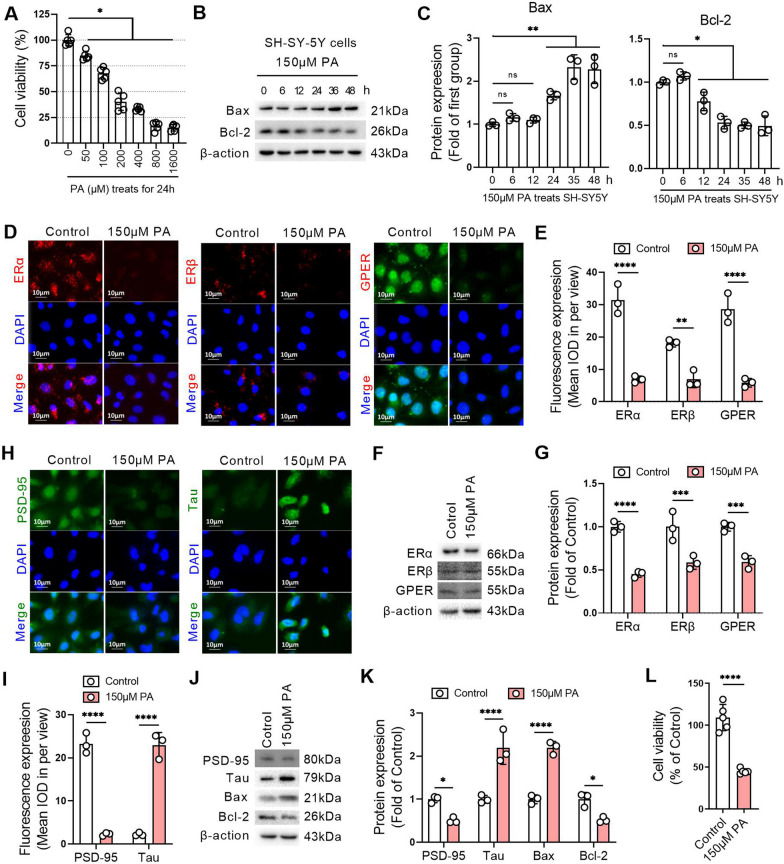
Fig. 5.
Lipid overload leads to decreased ERs and promotes apoptosis in SH-SY5Y cells. A An MTT assay was used to detect the viability of SH-SY-5Y cells treated with different concentrations of palmitic acid (PA) for 24 h. B Western blotting was performed to detect Bax and Bcl-2 expression in SH-SY-5Y cells treated with 150 µM PA for different duration. C Related to B, the relative quantitative analysis of Bax and Bcl-2 expression in SH-SY-5Y cells. D The expression levels of ERα, ERβ and GPER were detected by immunofluorescence in SH-SY-5Y cells with or without 150 µM PA treatment for 24 h. E Related to D, the quantitative analysis of the mean optical density of ERα, ERβ and GPER expression in SH-SY-5Y cells. F The expression levels of ERα, ERβ and GPER were detected by western blot in SH-SY-5Y cells with or without 150 µM PA treatment for 24 h. G Related to F, the relative quantitative analysis of ERα, ERβ and GPER expression in SH-SY-5Y cells. H The expression levels of PSD-95 and Tau were detected by immunofluorescence in SH-SY-5Y cells with or without 150 µM PA treatment for 24 h. I Related to H, the quantitative analysis of the mean optical density of PSD-95 and Tau expression in SH-SY-5Y cells. J The expression levels of PSD-95, Tau, Bax, and Bcl-2 were detected by western blot in SH-SY-5Y cells with or without 150 µM PA treatment for 24 h. K Relative quantitative analysis of PSD-95, Tau, Bax, and Bcl-2 expression in SH-SY-5Y cells. L An MTT assay was used to detect the viability of SH-SY-5Y cells treated with or without 150 µM PA for 24 h. A and L, n = 6. B–K, n = 3. In the indicated comparison, *P < 0.05, **P < 0.01, ***P < 0.001, ****P < 0.0001

