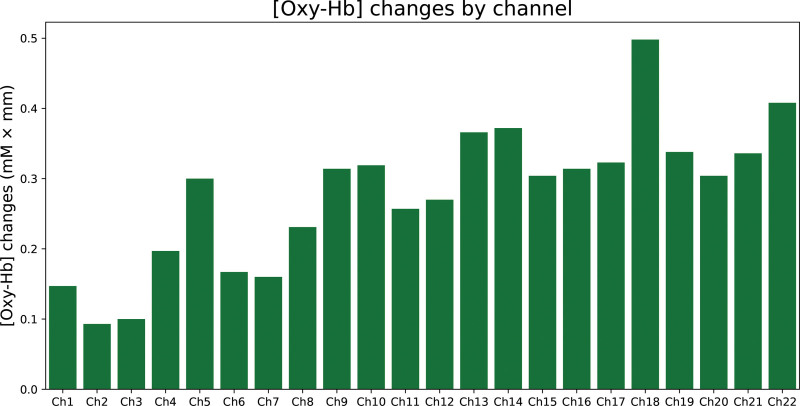
Figure 3.
Change in oxygenated hemoglobin concentration by cognitive activation. Each oxygenated hemoglobin concentration change per channel were as follows; #1: 0.147, #2: 0.093, #3: 0.100, #4: 0.197, #5: 0.300, #6: 0.167, #7: 0.160, #8: 0.231, #9: 0.314, #10: 0.319, #11: 0.257, #12: 0.270, #13: 0.366, #14: 0.372, #15: 0.304, #16: 0.314, #17: 0.323, #18: 0.498, #19: 0.338, #20: 0.304, #21: 0.336, #22: 0.408 (each channel number is presented after #).

