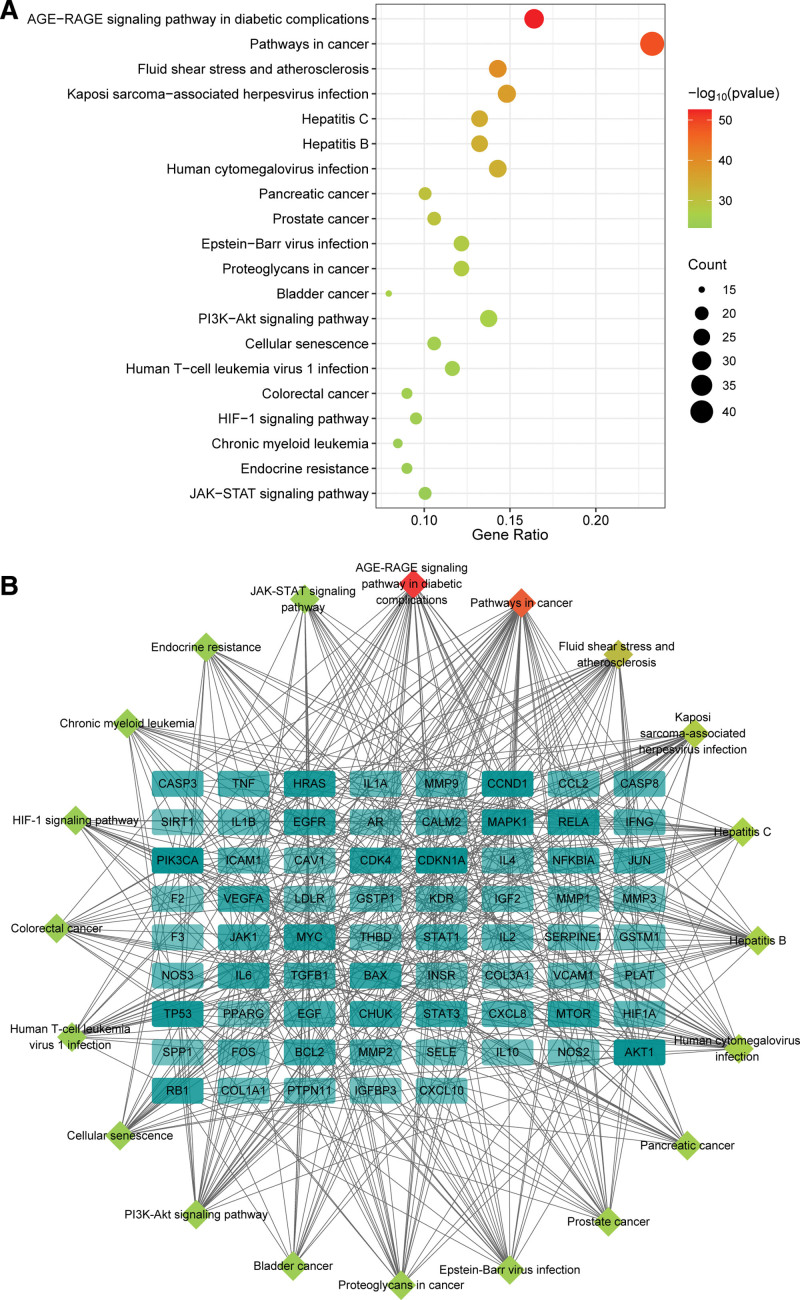
Figure 7.
KEGG enrichment analysis. (A) Top 20 terms of KEGG enrichment analysis. (B) The pathway-target network. The rhombic nodes represent KEGG pathways. The rectangle nodes represent the gene, and the darker color represents the higher degree value of the gene. KEGG = Kyoto Encyclopedia of Genes and Genomes.

