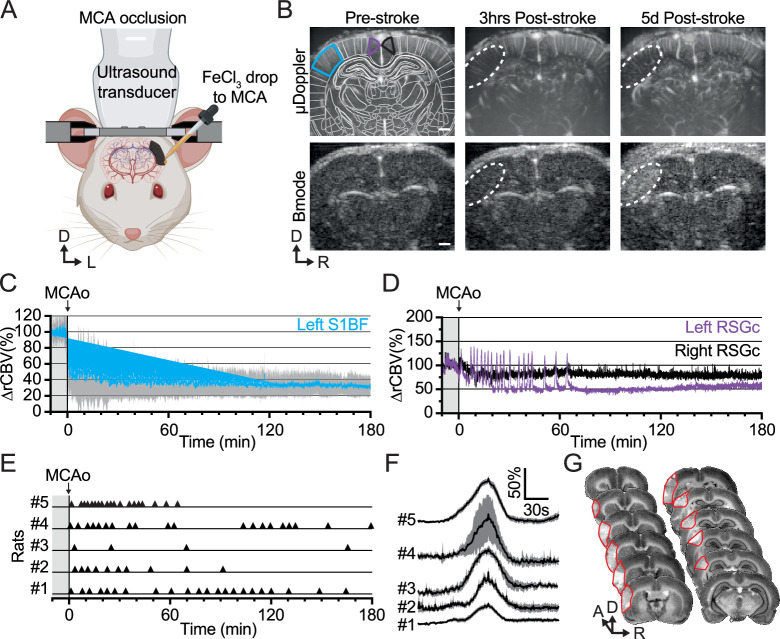
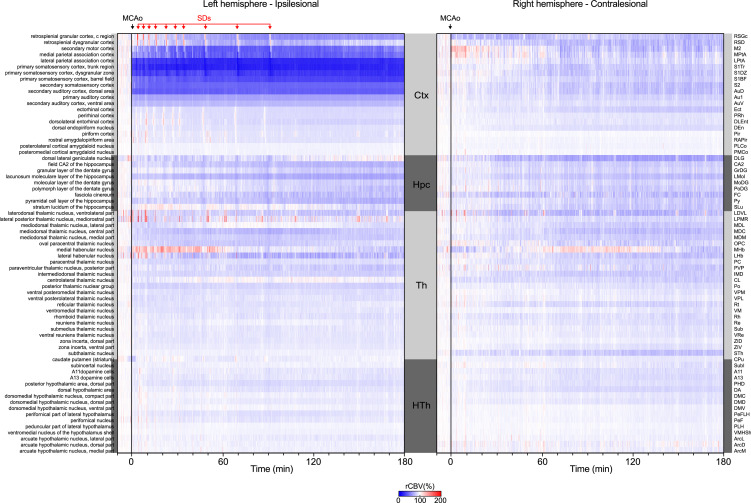
Figure 2. Ferric chloride (FeCl3)-stroke induction under awake conditions.
(A) Front view representation of functional ultrasound (fUS) imaging during live chemo-thrombosis of the left middle cerebral artery (MCA) with FeCl3 in awake head-fixed rats. (B) Set of typical coronal µDoppler images of the brain microvasculature (top row) and morphological Bmode images (bottom row) before stroke (left), 3 hr (middle), and 5d after stroke onset (right) from the same animal. µDoppler images (top left) were registered and segmented based on a digital version of the rat brain atlas (white outlines). Colored outlines (cyan, purple, and black) delineate regions of interest plotted in (C) and (D). The white dotted region of interest highlights the ischemia in µDoppler images (Top row) and tissue hyper-echogenicity in Bmode (Bottom row). (C) Temporal plot of the average signal (∆rCBV (%), mean ± 95% CI, n=5) in the barrel-field primary somatosensory cortex (S1BF, cyan) from the left hemisphere, affected by the MCA occlusion (MCAo). (D) Temporal plots of the average signal (∆rCBV (%)) in the retrosplenial granular cortex (RSGc) from the affected (purple) and non-affected hemisphere (black) from the same animal. (E) Occurrence of spreading depolarizations after MCAo. Each horizontal line represents one rat; each triangle marker depicts the occurrence of one spreading depolarization. (F) Temporal plots of the average signal change (∆rCBV (%), mean ± 95% CI, respectively black line and gray band) of hemodynamic events associated with spreading depolarizations (centered on the peak) for each rat (#1–5). (G) Typical rat brain cross-sections stained by cresyl violet to evaluate the tissue infarction at 24 hr after FeCl3-induction occlusion of MCA. The infarcted territory is delineated in red. Scale bars: 1 mm. D: Dorsal; L: left; R: right.


