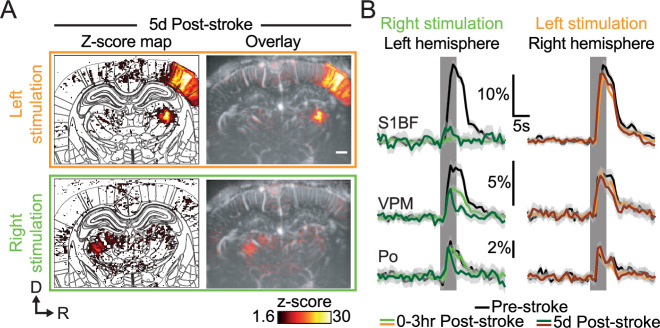
Figure 4. Late post-stroke alteration of whisker-to-barrel thalamocortical circuit.
(A) Activity maps (z-score; average of 45 trials) depicting evoked functional responses to left (orange) or right whisker pads stimulation (green) 5d after stroke induction. Z-score maps are registered with the Paxinos atlas (white outlines; Left) and overlaid with the corresponding coronal µDoppler image (Right). (B) Left; Average response curves to left and right whisker stimulation (orange and green; respectively) extracted from S1BF, VPM, and Po before (Pre-stroke, black, n=2, 45 trials/rat), 0–3 hr (0–3 hr Post-Stroke; light orange/green, n=2, 45 trials/hr/rat) and 5d after stroke induction (5d Post-stroke, dark orange/green, n=2, 45 trials/rat). Data are mean ± 95% CI. The vertical bar represents the whisker stimulus. Scale bars: 1 mm. D: Dorsal; R: right; S1BF: barrel-field primary somatosensory cortex; VPM: Ventral posteromedial nucleus of the thalamus; Po: Posterior nucleus of the thalamus.

