
Figure 2. A.
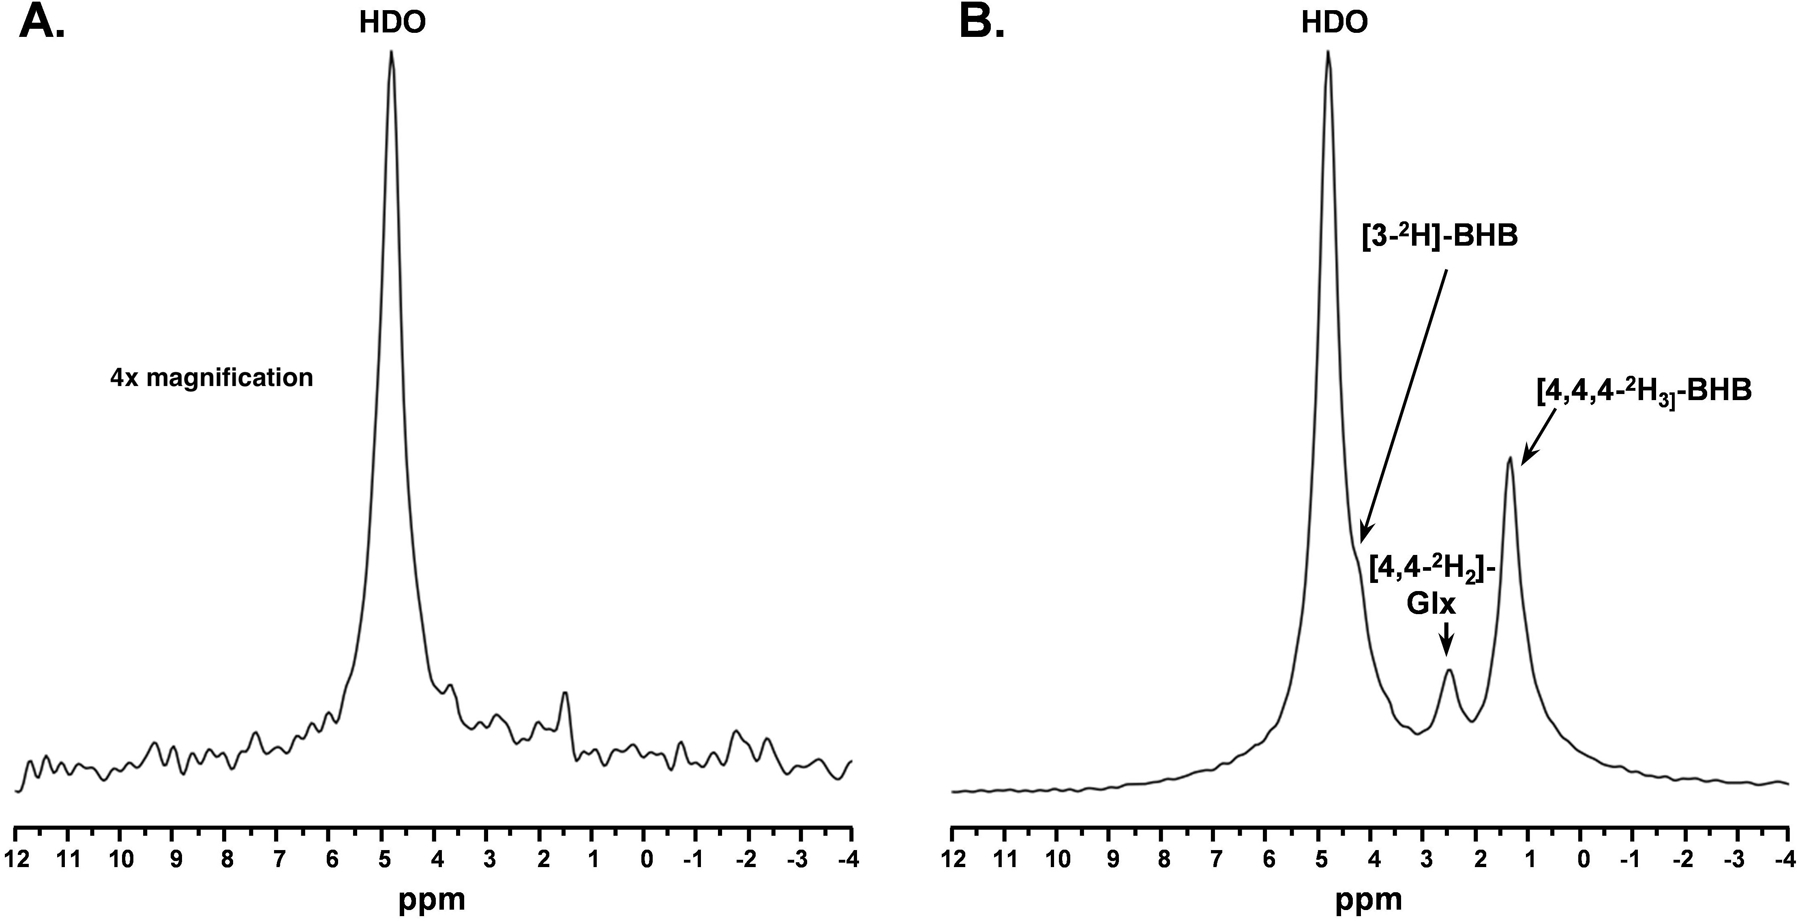
Baseline 2H MR spectra (4x vertically magnified) prior to infusion of d4-BHB and B. A representative spectrum was acquired 43.75 minutes post-infusion with three observable peaks corresponding to HDO (4.8ppm), 3-CD-BHB (4.2ppm), 4,4-CD2-Glx (2.4ppm), and 4,4,4-CD3-BHB (1.3ppm).