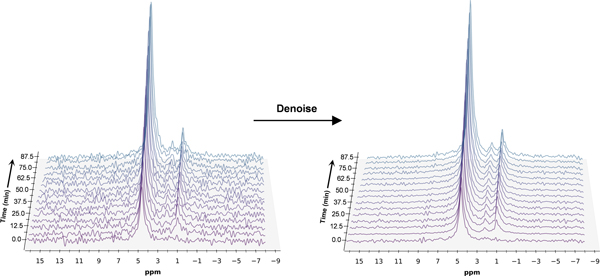
Figure 3.

Time series plot of 2H spectra obtained with a temporal resolution of 6.25 minutes, showing the evolution of BHB, Glx, and HDO. Spectra are presented before and after denoising, with substantial improvement in SNR for all observable metabolite peaks
