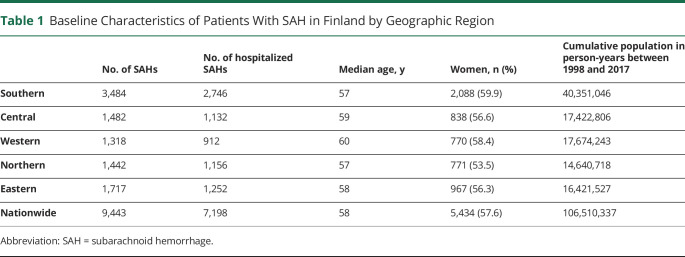
Table 1.
Baseline Characteristics of Patients With SAH in Finland by Geographic Region
| No. of SAHs | No. of hospitalized SAHs | Median age, y | Women, n (%) | Cumulative population in person-years between 1998 and 2017 | |
| Southern | 3,484 | 2,746 | 57 | 2,088 (59.9) | 40,351,046 |
| Central | 1,482 | 1,132 | 59 | 838 (56.6) | 17,422,806 |
| Western | 1,318 | 912 | 60 | 770 (58.4) | 17,674,243 |
| Northern | 1,442 | 1,156 | 57 | 771 (53.5) | 14,640,718 |
| Eastern | 1,717 | 1,252 | 58 | 967 (56.3) | 16,421,527 |
| Nationwide | 9,443 | 7,198 | 58 | 5,434 (57.6) | 106,510,337 |
Abbreviation: SAH = subarachnoid hemorrhage.

