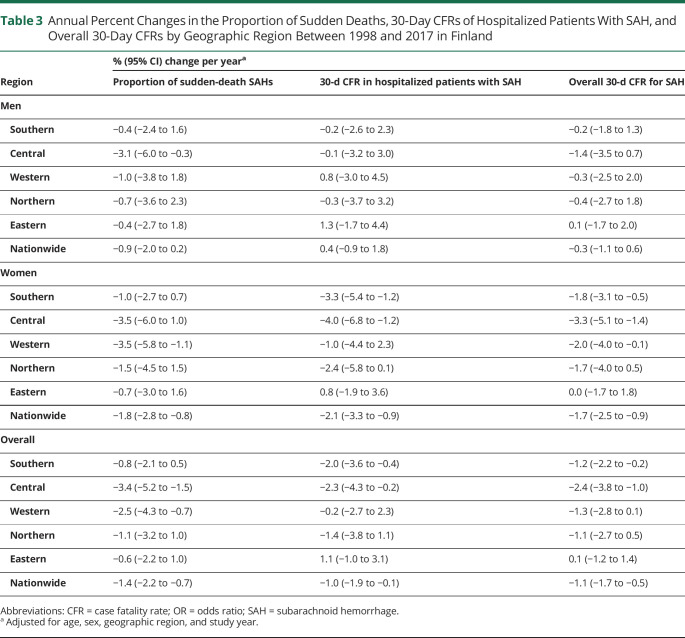
Table 3.
Annual Percent Changes in the Proportion of Sudden Deaths, 30-Day CFRs of Hospitalized Patients With SAH, and Overall 30-Day CFRs by Geographic Region Between 1998 and 2017 in Finland
| Region | % (95% CI) change per yeara | ||
| Proportion of sudden-death SAHs | 30-d CFR in hospitalized patients with SAH | Overall 30-d CFR for SAH | |
| Men | |||
| Southern | −0.4 (−2.4 to 1.6) | −0.2 (−2.6 to 2.3) | −0.2 (−1.8 to 1.3) |
| Central | −3.1 (−6.0 to −0.3) | −0.1 (−3.2 to 3.0) | −1.4 (−3.5 to 0.7) |
| Western | −1.0 (−3.8 to 1.8) | 0.8 (−3.0 to 4.5) | −0.3 (−2.5 to 2.0) |
| Northern | −0.7 (−3.6 to 2.3) | −0.3 (−3.7 to 3.2) | −0.4 (−2.7 to 1.8) |
| Eastern | −0.4 (−2.7 to 1.8) | 1.3 (−1.7 to 4.4) | 0.1 (−1.7 to 2.0) |
| Nationwide | −0.9 (−2.0 to 0.2) | 0.4 (−0.9 to 1.8) | −0.3 (−1.1 to 0.6) |
| Women | |||
| Southern | −1.0 (−2.7 to 0.7) | −3.3 (−5.4 to −1.2) | −1.8 (−3.1 to −0.5) |
| Central | −3.5 (−6.0 to 1.0) | −4.0 (−6.8 to −1.2) | −3.3 (−5.1 to −1.4) |
| Western | −3.5 (−5.8 to −1.1) | −1.0 (−4.4 to 2.3) | −2.0 (−4.0 to −0.1) |
| Northern | −1.5 (−4.5 to 1.5) | −2.4 (−5.8 to 0.1) | −1.7 (−4.0 to 0.5) |
| Eastern | −0.7 (−3.0 to 1.6) | 0.8 (−1.9 to 3.6) | 0.0 (−1.7 to 1.8) |
| Nationwide | −1.8 (−2.8 to −0.8) | −2.1 (−3.3 to −0.9) | −1.7 (−2.5 to −0.9) |
| Overall | |||
| Southern | −0.8 (−2.1 to 0.5) | −2.0 (−3.6 to −0.4) | −1.2 (−2.2 to −0.2) |
| Central | −3.4 (−5.2 to −1.5) | −2.3 (−4.3 to −0.2) | −2.4 (−3.8 to −1.0) |
| Western | −2.5 (−4.3 to −0.7) | −0.2 (−2.7 to 2.3) | −1.3 (−2.8 to 0.1) |
| Northern | −1.1 (−3.2 to 1.0) | −1.4 (−3.8 to 1.1) | −1.1 (−2.7 to 0.5) |
| Eastern | −0.6 (−2.2 to 1.0) | 1.1 (−1.0 to 3.1) | 0.1 (−1.2 to 1.4) |
| Nationwide | −1.4 (−2.2 to −0.7) | −1.0 (−1.9 to −0.1) | −1.1 (−1.7 to −0.5) |
Abbreviations: CFR = case fatality rate; OR = odds ratio; SAH = subarachnoid hemorrhage.
Adjusted for age, sex, geographic region, and study year.

