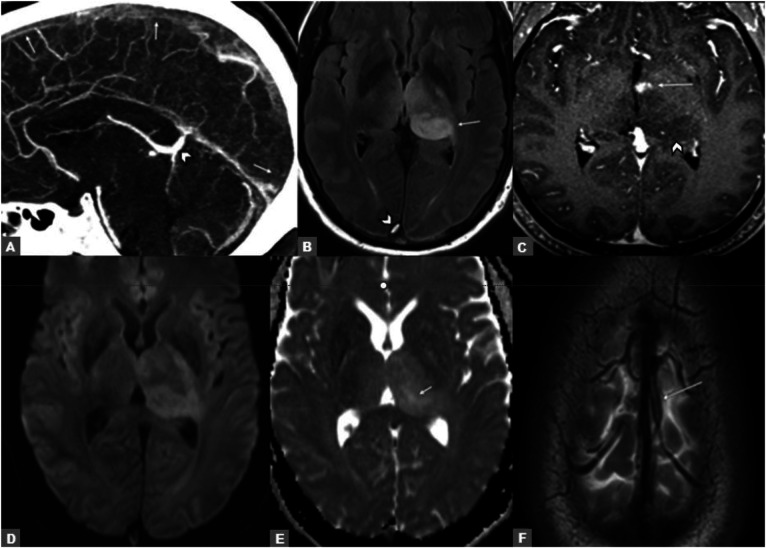
Figure 1. CT Venogram and Brain MRI.
(A) Initial CT venogram demonstrates filling defects in the superior sagittal sinus (SSS; arrows). Deep cerebral veins (arrowhead) enhanced normally. (B) Axial T2 FLAIR image demonstrates expansile left thalamic T2 hyperintensity (arrow) and SSS thrombosis (arrowhead). (C) Subsequent postcontrast T1 image shows focal enhancement (arrow) within the thalamic lesion (arrowhead). (D) Diffusion-weighted imaging and (E) apparent diffusion coefficient demonstrate facilitated diffusion (yellow arrow), which did not help distinguish between venous congestion and glioma. (F) Axial T2 image demonstrates left vein of Trolard thrombosis (arrow).

