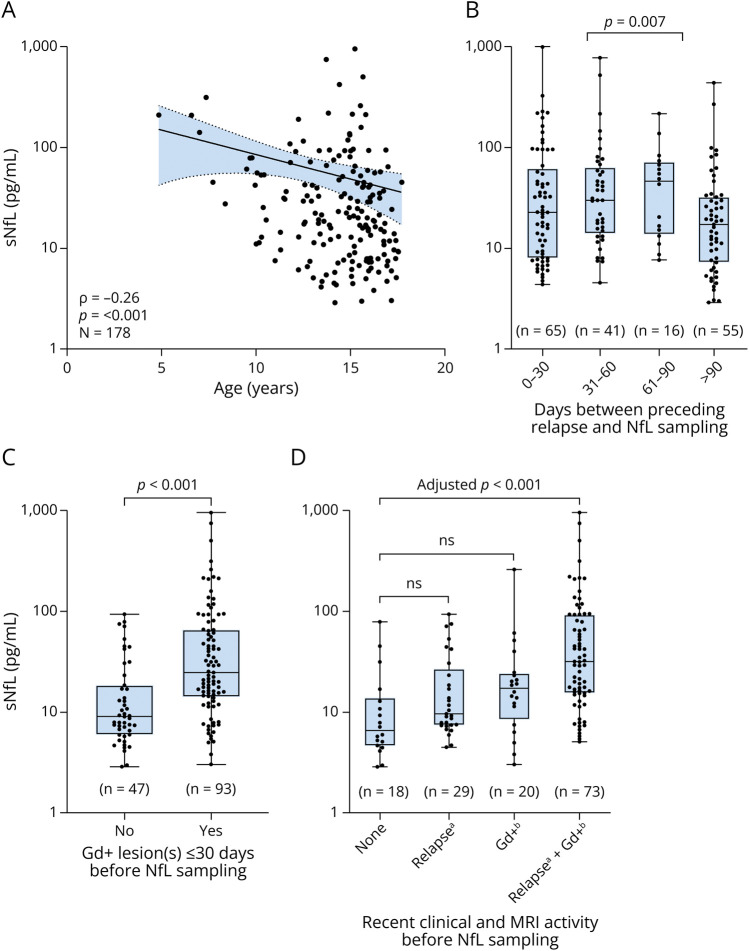
Figure 1. Influence of Age and Recent Disease Activity on sNfL Levels in Treatment-Naive Pediatric Patients With MS.
A positive correlation between age at sampling and sNfL is shown in graph (A). Line indicates linear fit to the observed data and 95% confidence bands. Positive associations between sNfL and recent clinical and MRI activity before sampling are shown as boxplots in graph (B), (C), and (D). Boxes depict median and interquartile range with whiskers extending to minimum and maximum values. Gd+ = gadolinium-enhanced; MS = multiple sclerosis; sNfL = serum neurofilament light chain.

