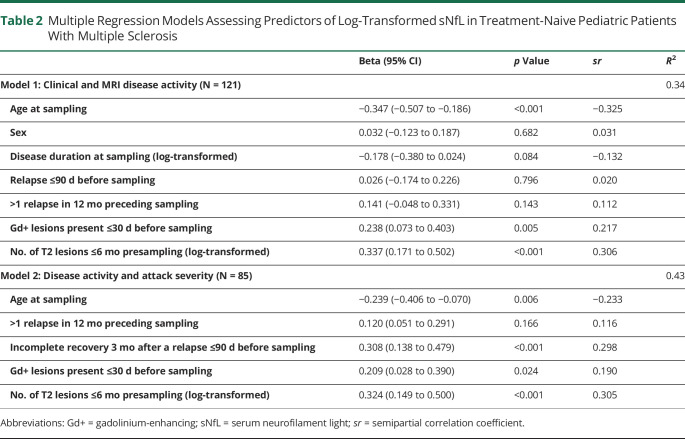
Table 2.
Multiple Regression Models Assessing Predictors of Log-Transformed sNfL in Treatment-Naive Pediatric Patients With Multiple Sclerosis
| Beta (95% CI) | p Value | sr | R 2 | |
| Model 1: Clinical and MRI disease activity (N = 121) | 0.34 | |||
| Age at sampling | −0.347 (−0.507 to −0.186) | <0.001 | −0.325 | |
| Sex | 0.032 (−0.123 to 0.187) | 0.682 | 0.031 | |
| Disease duration at sampling (log-transformed) | −0.178 (−0.380 to 0.024) | 0.084 | −0.132 | |
| Relapse ≤90 d before sampling | 0.026 (−0.174 to 0.226) | 0.796 | 0.020 | |
| >1 relapse in 12 mo preceding sampling | 0.141 (−0.048 to 0.331) | 0.143 | 0.112 | |
| Gd+ lesions present ≤30 d before sampling | 0.238 (0.073 to 0.403) | 0.005 | 0.217 | |
| No. of T2 lesions ≤6 mo presampling (log-transformed) | 0.337 (0.171 to 0.502) | <0.001 | 0.306 | |
| Model 2: Disease activity and attack severity (N = 85) | 0.43 | |||
| Age at sampling | −0.239 (−0.406 to −0.070) | 0.006 | −0.233 | |
| >1 relapse in 12 mo preceding sampling | 0.120 (0.051 to 0.291) | 0.166 | 0.116 | |
| Incomplete recovery 3 mo after a relapse ≤90 d before sampling | 0.308 (0.138 to 0.479) | <0.001 | 0.298 | |
| Gd+ lesions present ≤30 d before sampling | 0.209 (0.028 to 0.390) | 0.024 | 0.190 | |
| No. of T2 lesions ≤6 mo presampling (log-transformed) | 0.324 (0.149 to 0.500) | <0.001 | 0.305 |
Abbreviations: Gd+ = gadolinium-enhancing; sNfL = serum neurofilament light; sr = semipartial correlation coefficient.

