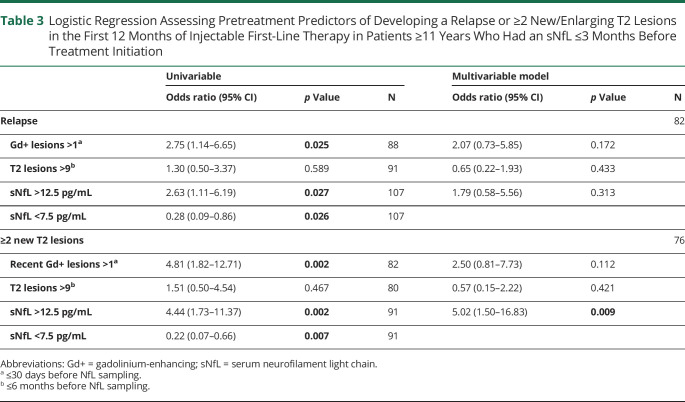
Table 3.
Logistic Regression Assessing Pretreatment Predictors of Developing a Relapse or ≥2 New/Enlarging T2 Lesions in the First 12 Months of Injectable First-Line Therapy in Patients ≥11 Years Who Had an sNfL ≤3 Months Before Treatment Initiation
| Univariable | Multivariable model | |||||
| Odds ratio (95% CI) | p Value | N | Odds ratio (95% CI) | p Value | N | |
| Relapse | 82 | |||||
| Gd+ lesions >1a | 2.75 (1.14–6.65) | 0.025 | 88 | 2.07 (0.73–5.85) | 0.172 | |
| T2 lesions >9b | 1.30 (0.50–3.37) | 0.589 | 91 | 0.65 (0.22–1.93) | 0.433 | |
| sNfL >12.5 pg/mL | 2.63 (1.11–6.19) | 0.027 | 107 | 1.79 (0.58–5.56) | 0.313 | |
| sNfL <7.5 pg/mL | 0.28 (0.09–0.86) | 0.026 | 107 | |||
| ≥2 new T2 lesions | 76 | |||||
| Recent Gd+ lesions >1a | 4.81 (1.82–12.71) | 0.002 | 82 | 2.50 (0.81–7.73) | 0.112 | |
| T2 lesions >9b | 1.51 (0.50–4.54) | 0.467 | 80 | 0.57 (0.15–2.22) | 0.421 | |
| sNfL >12.5 pg/mL | 4.44 (1.73–11.37) | 0.002 | 91 | 5.02 (1.50–16.83) | 0.009 | |
| sNfL <7.5 pg/mL | 0.22 (0.07–0.66) | 0.007 | 91 | |||
Abbreviations: Gd+ = gadolinium-enhancing; sNfL = serum neurofilament light chain.
≤30 days before NfL sampling.
≤6 months before NfL sampling.

