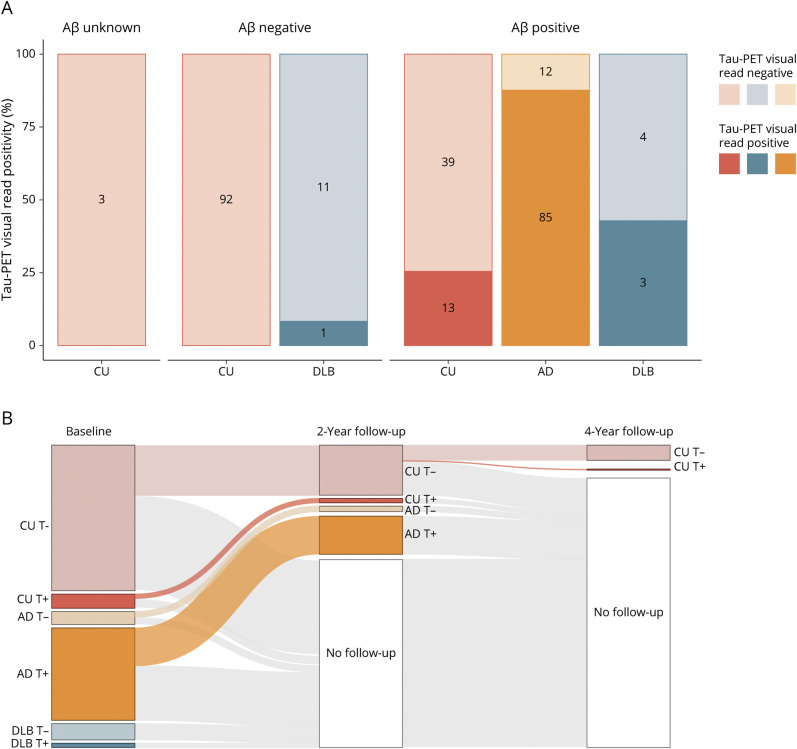
Figure 1. Cross-sectional and Longitudinal Tau-PET Visual Read Status.
(A) The prevalence of baseline tau-PET positivity stratified according to diagnostic group (CU, AD, and DLB) and Aβ status (unknown, negative, and positive) is shown. Numbers indicate the number of participants visually read as tau-negative or tau-positive within each group. (B) Tau-PET visual read status (positive [+] or negative [−]) for each diagnostic group at baseline, 2-year follow-up, and 4-year follow-up indicates that outcome of the visual read method is stable over time. The single CU participant that converted to tau-positive at 4-year follow-up was Aβ positive. Aβ = β-amyloid; AD = Alzheimer disease; CU = cognitively unimpaired; DLB = dementia with Lewy bodies.

